

The HP EliteBook X G2i is HP’s premium 14-inch business notebook, and the company is not shy about the AI branding: the formal model name is the EliteBook X G2i 14-inch Notebook Next Gen AI PC. Our review unit runs Intel’s Core Ultra 7 366H, a Series 3 Panther Lake part with 16 cores and vPro, with 32GB of LPDDR5x at 8533 MT/s, a 1 TB SK hynix Gen5 SSD, and a 14-inch 2880 x 1800 display. It is a Copilot+ PC aimed squarely at the corporate fleet, and in our testing, it posted the strongest PCMark 10 Productivity score we have recorded from this class of machine.
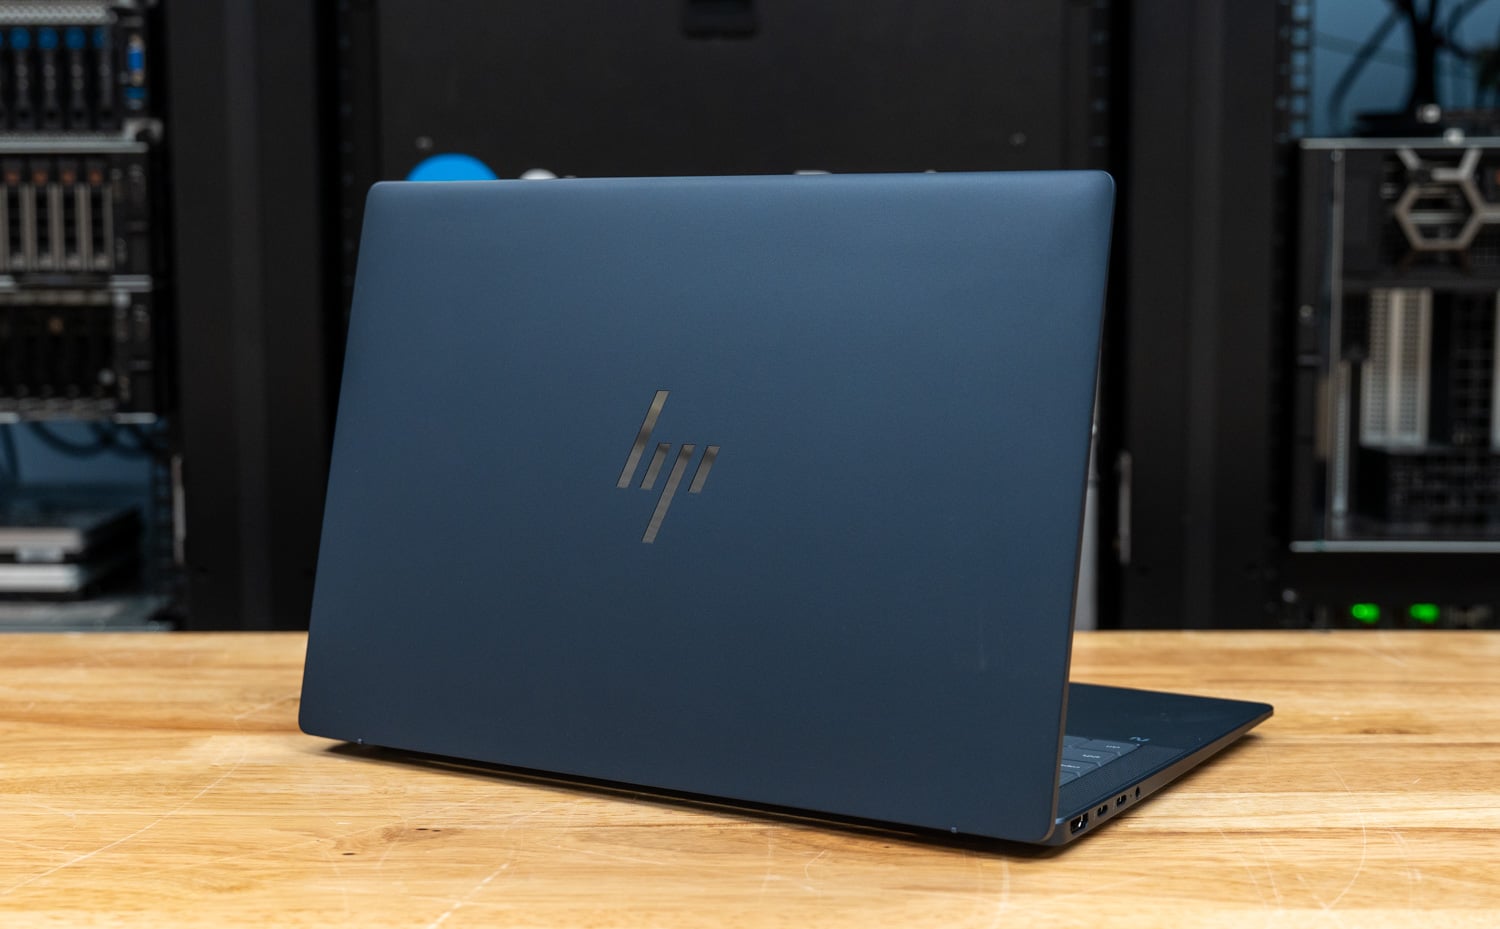
HP positions this generation around choice in two places most business laptops treat as fixed. There are two display options, and the shell comes in three finishes: Eclipse Gray, Glacier Silver, and the Atmospheric Blue on our review unit, a splash of personality that is unusual in a segment that defaults to silver and shades of black. Our review unit had two display options: a 1920×1200 OLED with 300 nits of brightness and a 3 K 120 Hz OLED with 500 nits of brightness. Higher resolution and brightness do have the trade-off of increased battery drain, which is quite evident in our battery testing.
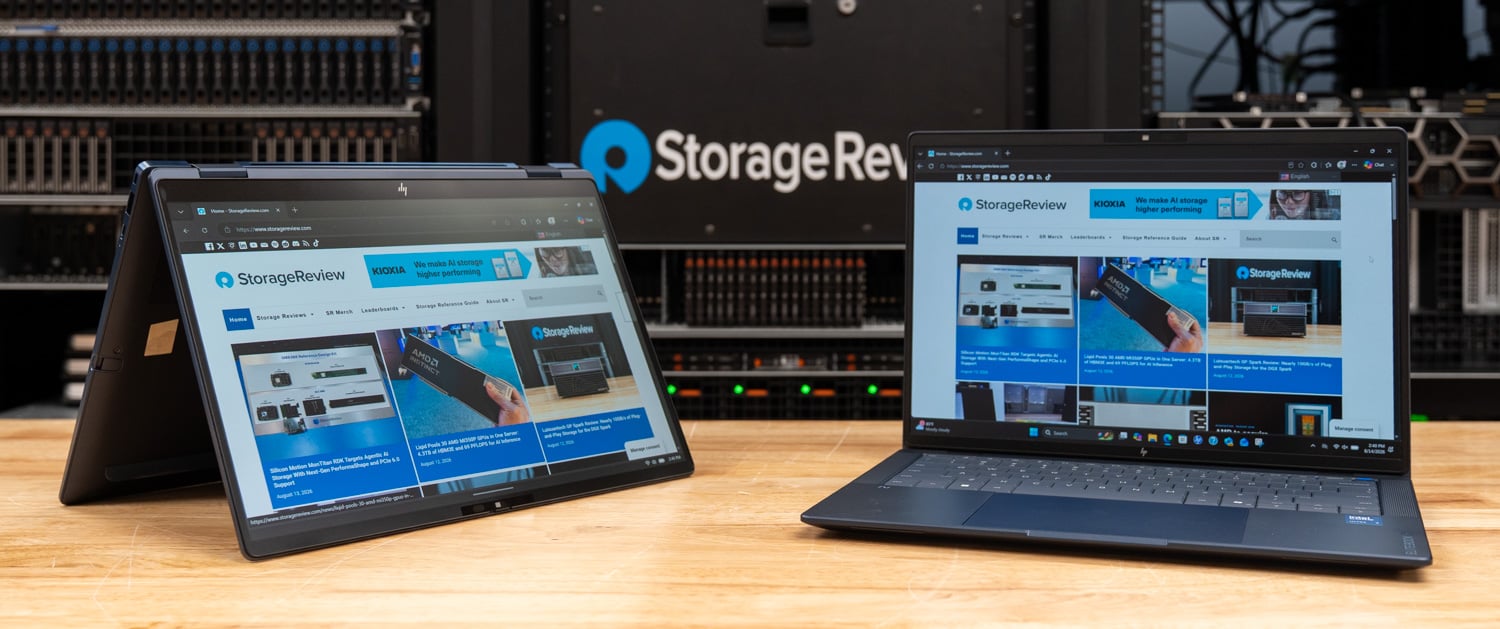
Two configuration notes matter. First, HP sent us both members of the family: this EliteBook X G2i and its convertible twin, the EliteBook X Flip G2i. The full benchmark suite reflects the clamshell; we ran battery testing only on the Flip because the two differ meaningfully in display, and we wanted to isolate the panel’s impact on runtime. The Flip earns a brief word in Build and Design but is otherwise not the subject of this review.
Second, and worth being direct about: our unit is not where this platform tops out. HP builds the EliteBook X G2i in two graphics tiers, the 4 Xe-core integrated graphics in our Core Ultra 7 366H unit, which HP positions as the mainstream configuration for everyday productivity, and a 12 Xe-core Arc B390 tier on the Core Ultra X7 358H, paired with a 3K OLED panel, that HP describes as delivering near-discrete GPU performance for analytics, content creation, and local AI work. HP’s own workshop figures claim 3.2 times faster AI image generation and 2.3 times faster hardware-accelerated workflows for the 12 Xe tier, and our comparison data supports the scale of that claim: the same Arc B390 silicon in the Dell Pro 5 14 Intel runs 2.2 to 2.3 times ahead of our review unit in Geekbench GPU compute, Blender, and Stable Diffusion. Every GPU result in this review should be read with that ceiling in mind; we tested the volume build, not the fastest one.
HP does not have a full configurator live for the EliteBook X G2i, so pricing is a snapshot of current stock rather than a build-to-order quote. Our exact build, the Core Ultra 7 366H with the non-touch 3K OLED, was not orderable at this writing. The closest in-stock clamshell is the Arc B390 tier we reference throughout this review: the Core Ultra X7 358H with the same 32GB, 1TB, and 3K OLED fit-out, listed at $6,270 but selling for $3,399 during HP’s current sale. The Flip variant of our 366H configuration sells for $2,999. HP list prices carry heavy standing discounts, so the street figures are the realistic reference points.
HP EliteBook X G2i Specifications
| Specification | HP EliteBook X G2i |
|---|---|
| Model | HP EliteBook X G2i 14-inch Notebook Next Gen AI PC |
| Processor | Intel Core Ultra 7 366H vPro (Series 3), 16 cores / 16 threads, up to 4.8GHz, 50 TOPS Intel AI Boost NPU |
| Graphics | Integrated Intel Graphics, 4 Xe cores (HP offers a 12 Xe Arc B390 tier on the X7 358H config) |
| Memory | 32GB LPDDR5x, 8533 MT/s, soldered |
| Storage | 1TB SK hynix PCB01 (HFS001TFM9X187N), PCIe Gen5 NVMe |
| Display | 14-inch 3K (2880 x 1800) OLED, 120Hz, anti-glare, 500 nits, 100% DCI-P3 |
| Operating System | Windows 11 Pro, Copilot+ PC |
| Battery | 68 Watt-hour battery |
| Ports | 1 HDMI 2.1 1 stereo headphone/microphone combo jack 1 nano security lock slot 1 USB Type-A 5Gbps signaling rate (powered) 2 Thunderbolt 4 with USB Type-C 40Gbps signaling rate (USB Power Delivery 3.0, DisplayPort 2.1) 1 USB Type-C 10Gbps signaling rate (USB Power Delivery 3.0, DisplayPort 1.4) |
| Wireless | Intel Wi-Fi 7 BE211 2×2, Bluetooth 6 |
| Weight | Starting at 0.99kg (2.18 lb) Tested Clamshell 2.4lb/1.088kg, 2-in-1 3.18lb/1.37kg |
| Colors | Eclipse Gray, Glacier Silver, Atmospheric Blue (as tested) |
| Price | Exact configuration not currently orderable; closest in-stock build (Core Ultra X7 358H / Arc B390, 32GB, 1TB, 3K OLED) $3,399 at this writing |
Build and Design
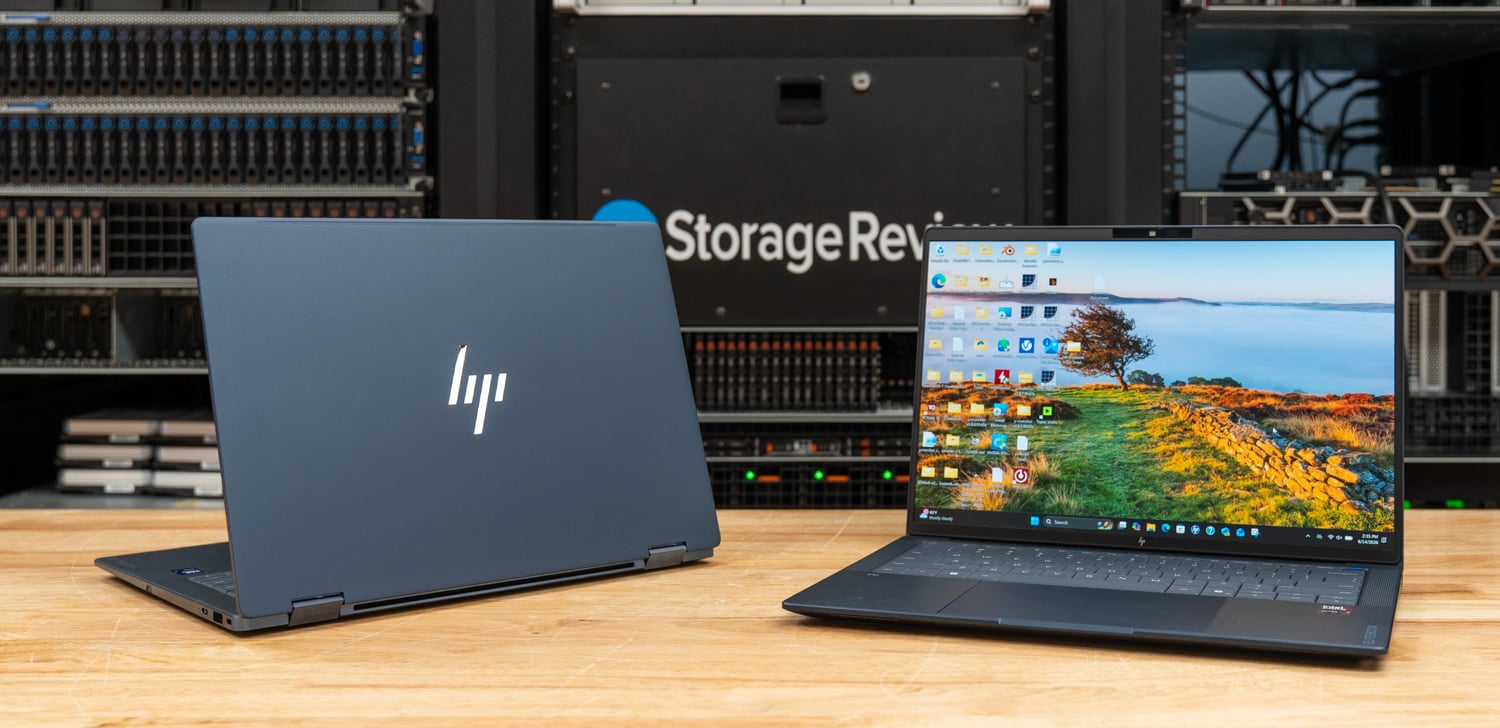
The EliteBook X G2i is HP’s lead design for its business line, and our review unit makes a strong case for Atmospheric Blue, one of three finishes offered alongside Eclipse Gray and Glacier Silver. This range of color choices is rare in a segment that usually defaults to silver, and in person, the Atmospheric Blue finish feels corporate-professional rather than consumer-focused, with a deep matte tone that hides fingerprints well. The chassis starts at 0.99kg for the lightest build and carries MIL-STD 810H testing, ENERGY STAR certification, and EPEAT Climate+ Gold registration. Our clamshell model weighed 2.4 pounds, and the 2-in-1 model weighed 3.18 pounds, which we believe is mainly due to the aluminum top shell on the 2-in-1 compared to the plastic top shell on the clamshell version.
HP sent us both members of this family, and the pair photographed well together. We benchmarked the clamshell. The EliteBook X Flip G2i convertible folds into tent mode and then into a tablet, and it accepts an optional rechargeable pen that nests inside the chassis. The Flip carries touch panels across its range and gives up the clamshell’s brightest options, which is why it appears in our battery table and nowhere else in this review; the four extra hours it ran are due to the display difference doing the work.
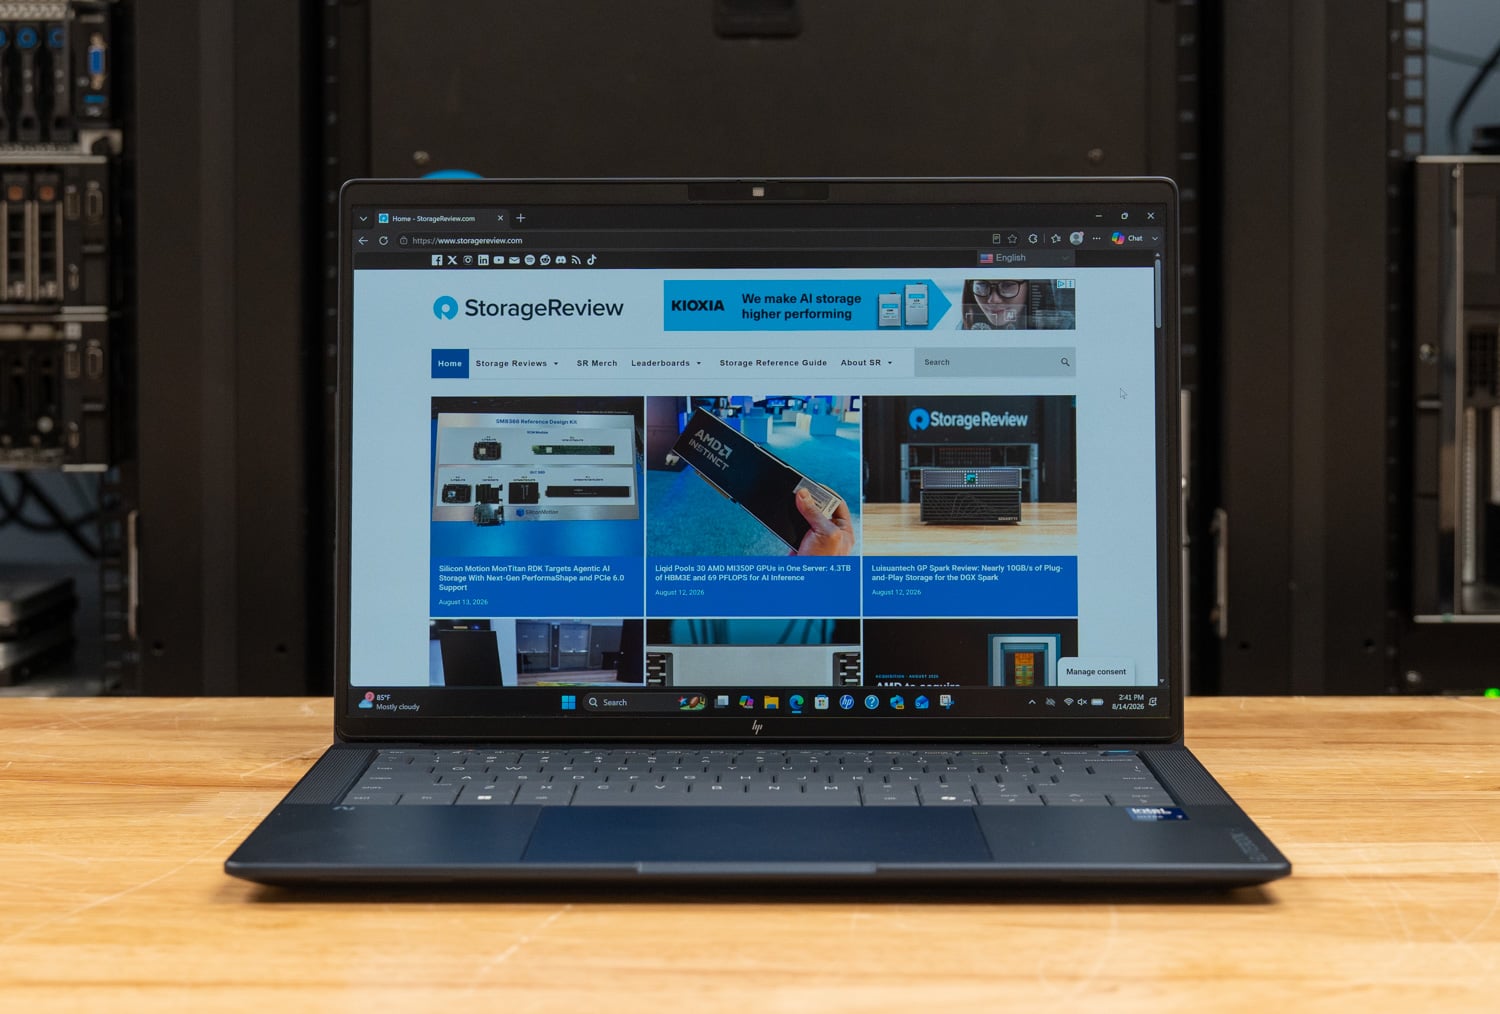
Our unit’s panel is the 14-inch 3K at 2880 x 1800 with a 120Hz refresh, the resolution HP reserves for the top of the display stack. The two-screen strategy is the interesting choice here: the volume configurations run WUXGA at 1920 x 1200 in brightness tiers up to an 800-nit Sure View privacy option, while the 3K tier steps up to OLED, including a 700-nit Tandem OLED touch variant. That is a genuinely wide range for one chassis, and it means two EliteBook X G2i units on the same desk can carry very different screens.
HP pitches the new Tandem OLED at the top of that stack as significantly brighter, with double the panel lifespan and lower power draw. Though our brighter model lacks the all-glass display of its touchscreen counterpart, it still delivers a strong image, backed by its 3k resolution, as shown below. This display would likely perform better in high light or outdoor environments.

The keyboard is HP’s spill-resistant, backlit Premium layout, and its party trick is invisible: the assembly is top-mounted and comes off in three steps with no screws, a swap HP says takes about ten minutes, against competitor designs the company says need many more screws and a full teardown to reach a bottom-mounted keyboard. HP sells a standalone keyboard replacement kit, around $100 to $150 per the workshop, and a QR code engraved on the bottom cover will link straight to replacement ordering. The power key integrates the fingerprint reader, so one press boots and authenticates.
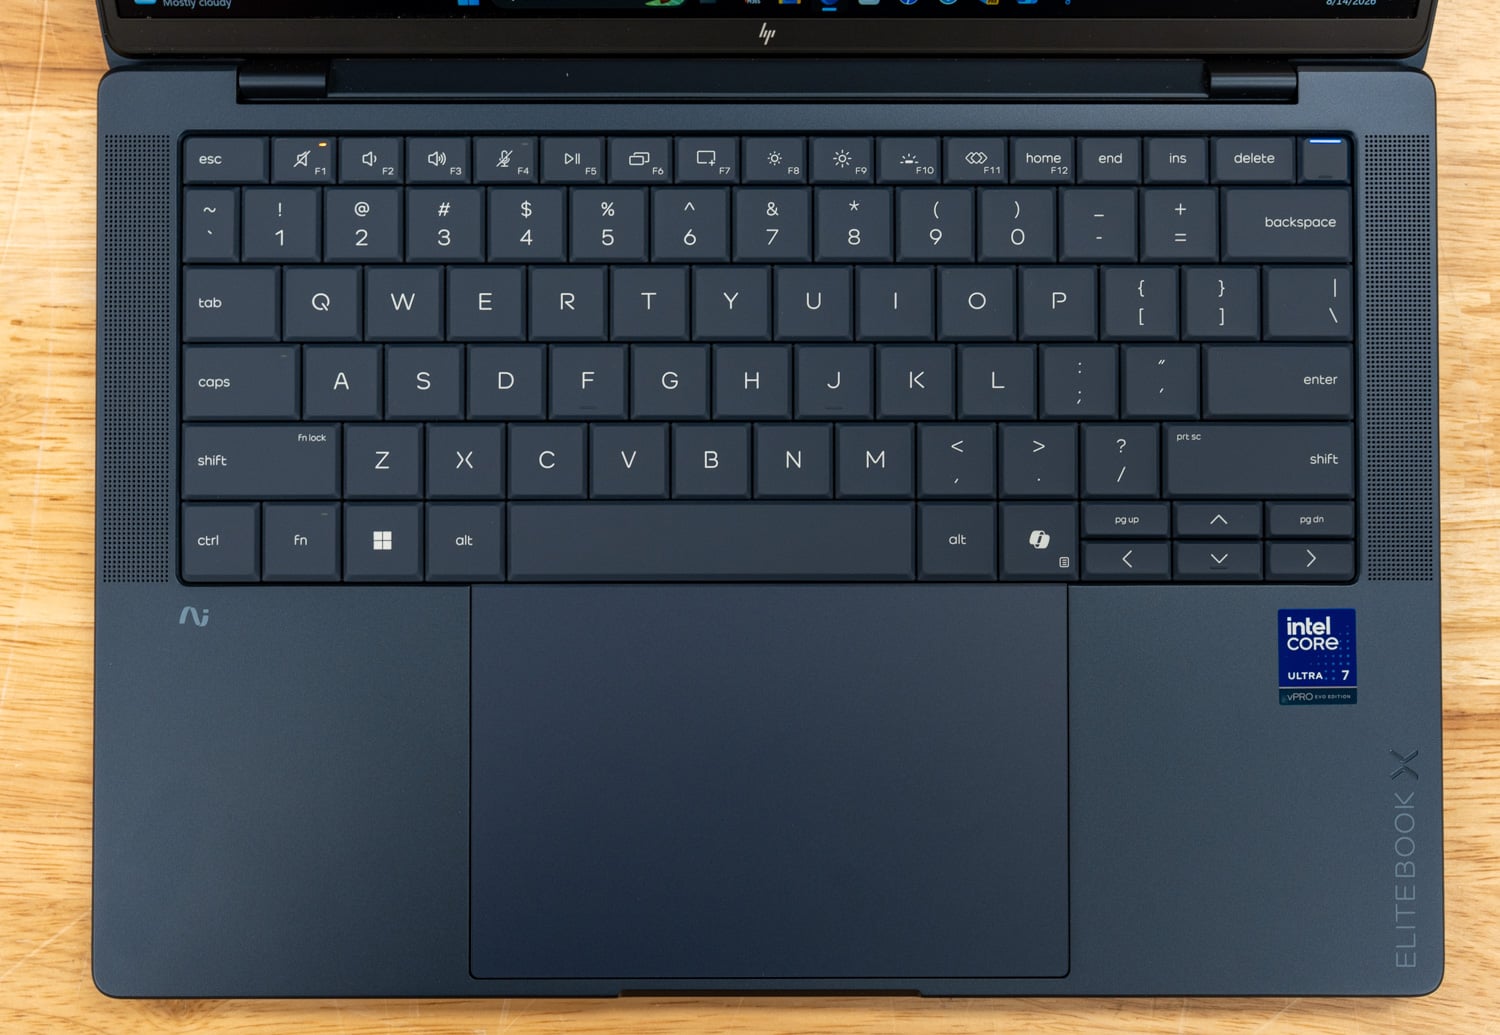
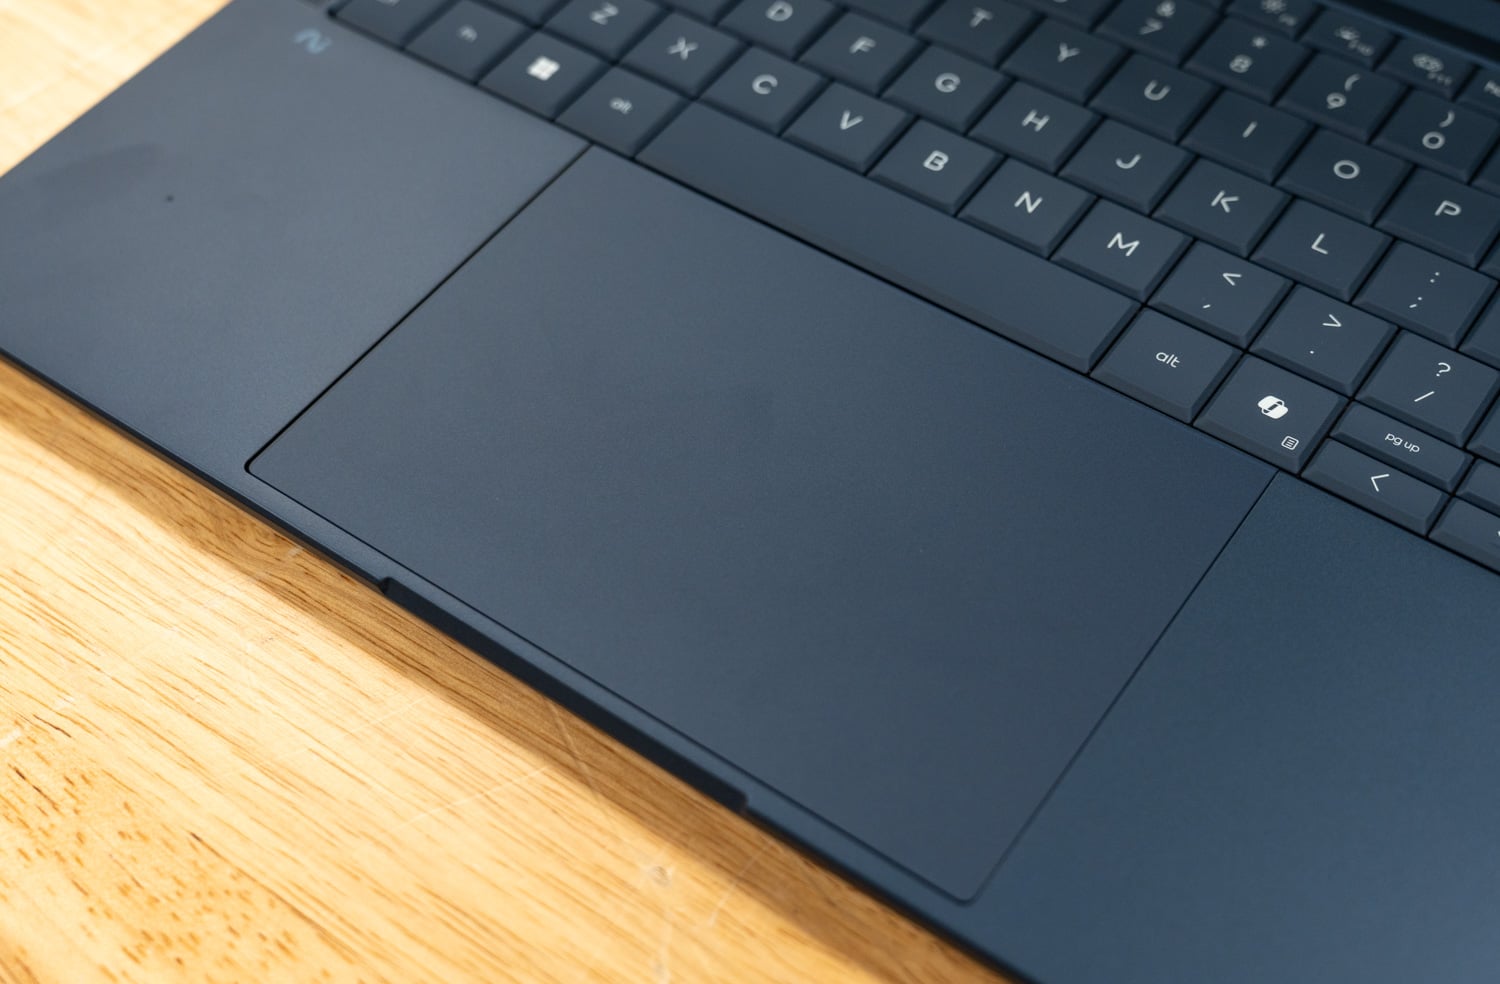
One item people tend not to pay much attention to when purchasing is the trackpad. Here, the trackpad features a haptic design that HP says is about 23% larger this generation, with a waterfall edge that doubles as a slider for brightness and volume, and it is its own module, replaceable without disturbing the keyboard. Our review units have haptic touchpads that let you adjust click sensitivity and haptic intensity directly in Windows settings, along with customizable multi-finger gestures for media, app, and desktop controls.
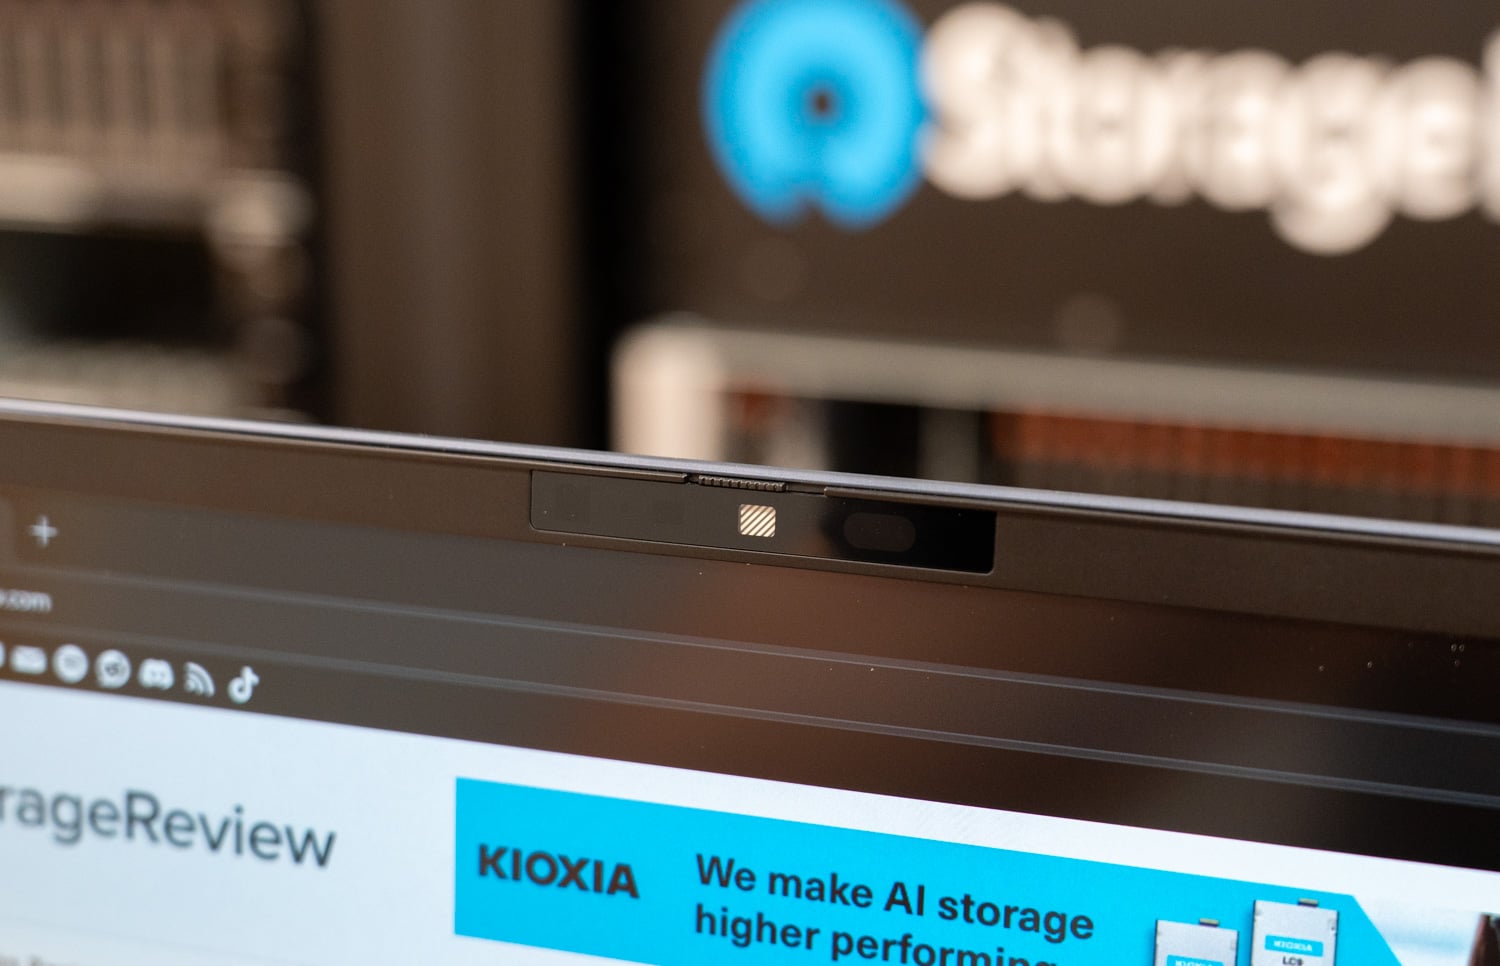
Above the display, the 5MP IR camera handles Windows Hello and feeds HP’s Poly Camera Pro stack, which runs framing, spotlight, background blur, and virtual backgrounds on the NPU rather than the CPU, part of the AI PC story that holds up in our Procyon NPU results. Dynamic Voice Leveling and AI noise reduction ride along on the audio side.
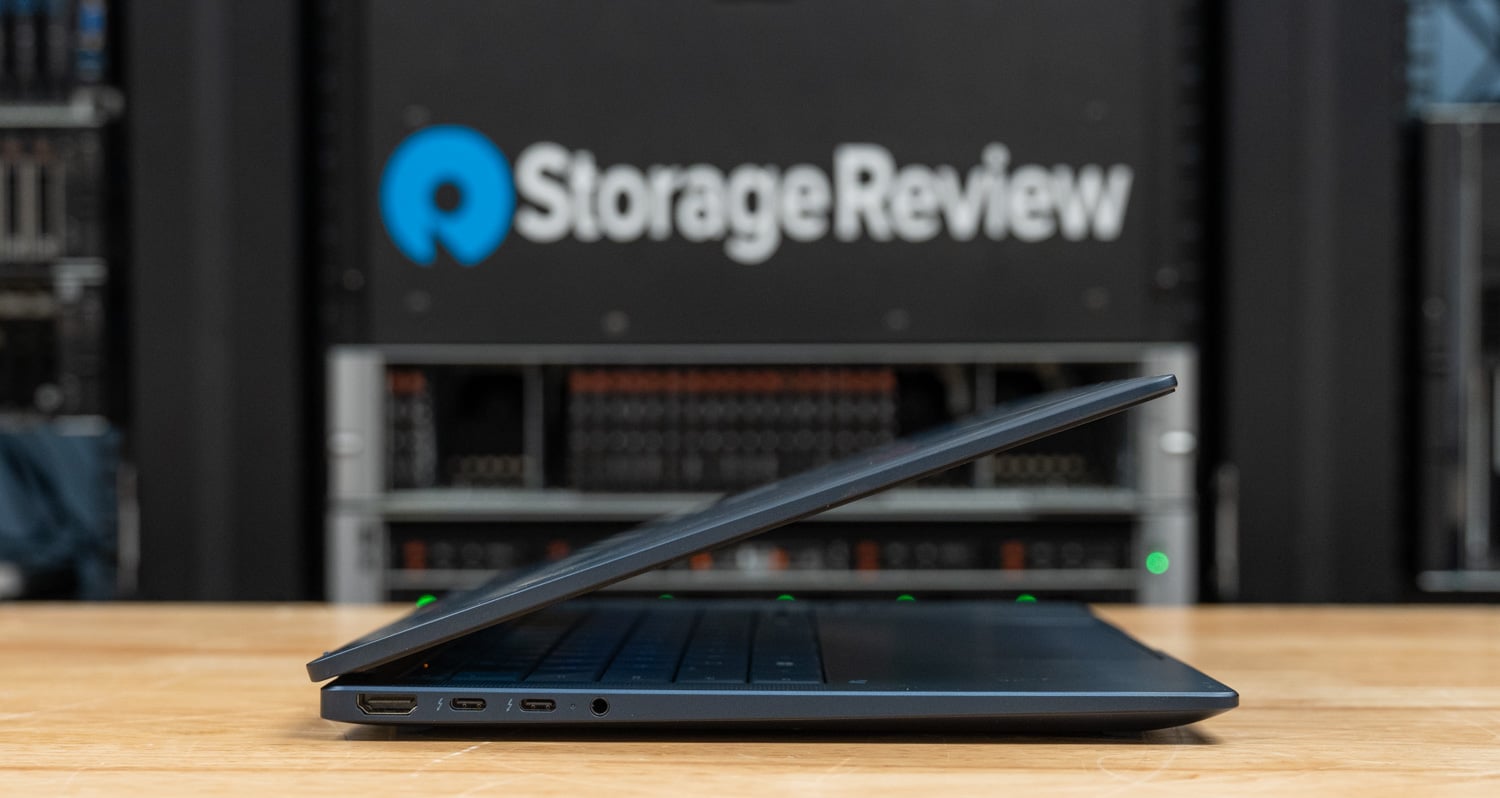
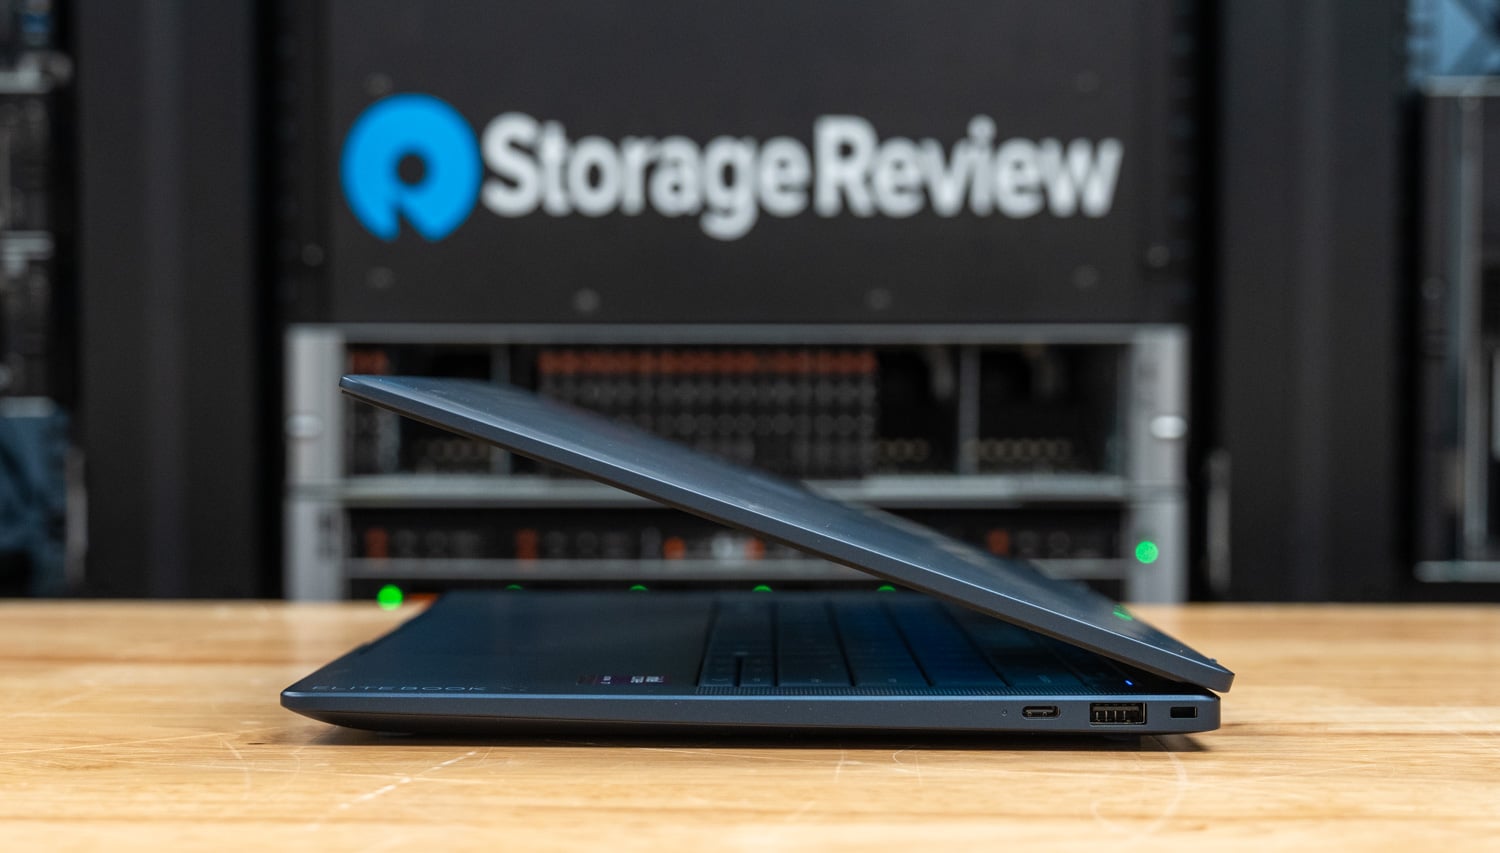
Connectivity is stronger than the thin chassis suggests. One edge carries HDMI 2.1, two Thunderbolt 4 USB-C ports, and the headset jack; the other adds a third USB-C, a powered USB-A for legacy peripherals, and the lock slot, with an optional nano SIM position for WWAN configurations. Wireless is Intel’s Wi-Fi 7 BE211 with Bluetooth 6.
It is necessary to note that during hands-on testing of the clamshell variant of the EliteBook X G2i, we observed noticeable deflection in the center of the top case. Though it was noticeable when carrying the notebook one-handed and closed, there was not much flex when opening the lid from a single corner. We did not observe any deflection on the 2-in-1 model, but it appears to be due to material differences between the variants. The clamshell model offers lightweight portability, while the 2-in-1 has a bit more heft in exchange for a stiffer top case for the flip function.
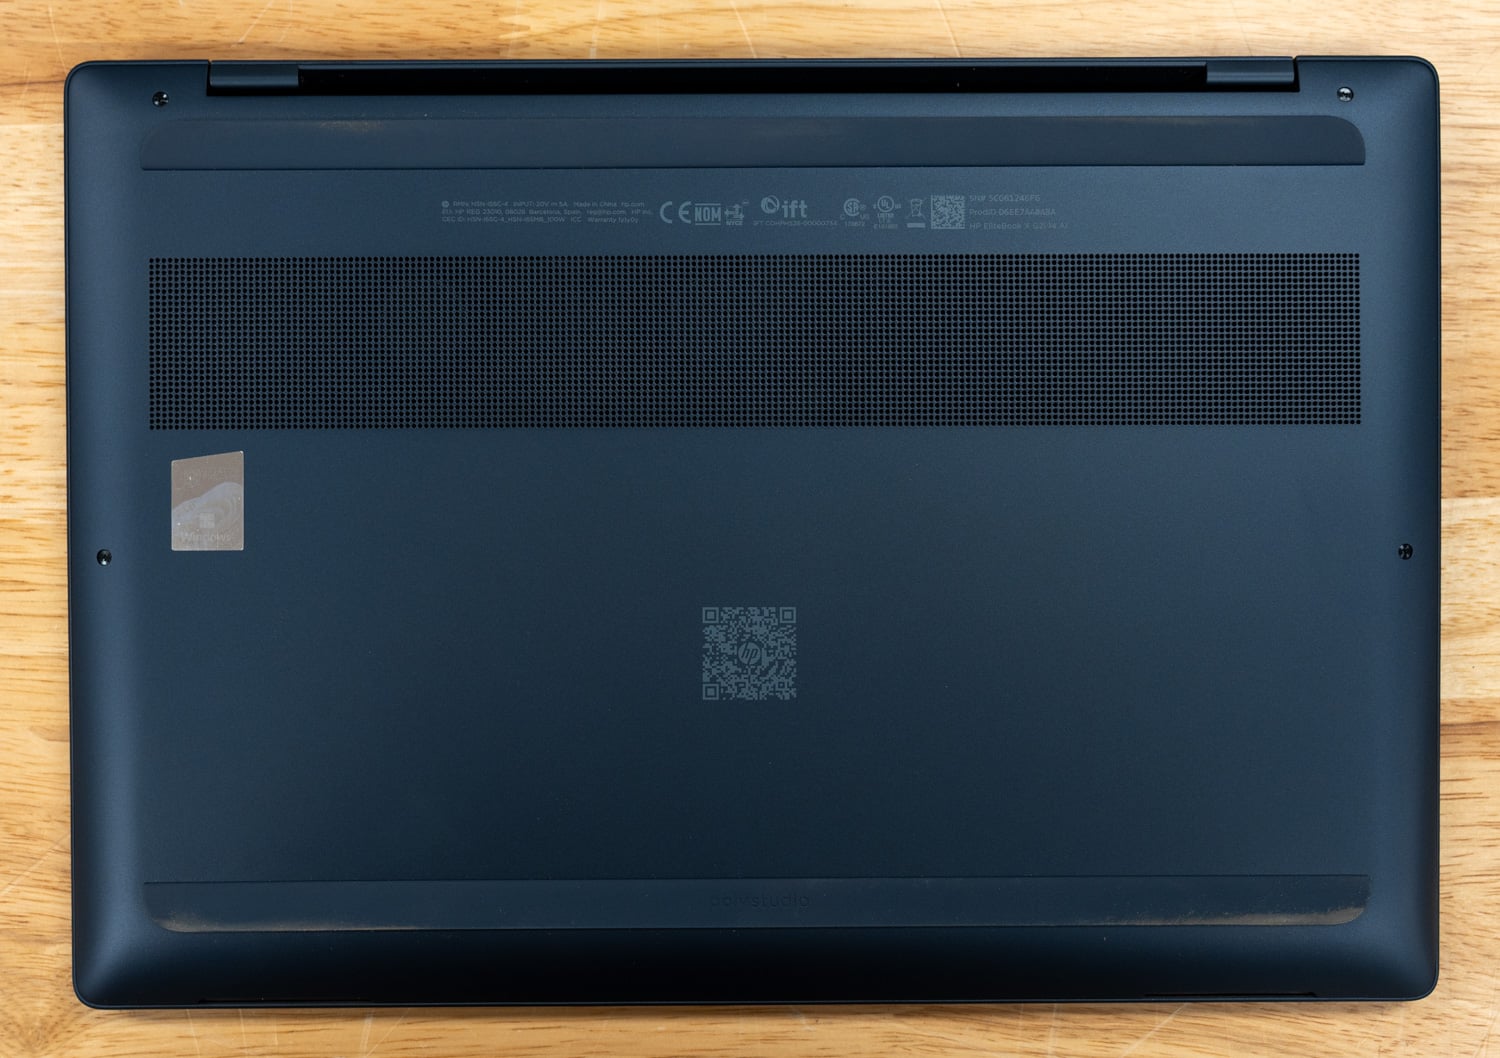
The underside is a single vent field feeding two fans. HP’s SmartSense uses motion sensors to distinguish a lap from a table and cools the underside accordingly. The Smart Resource Optimizer prioritizes foreground applications, delivering up to 15% better performance under heavy load, according to HP. A Battery Extender mode on the Intel models trades refresh rate, brightness, and conferencing effects for what HP says adds up to two extra hours.
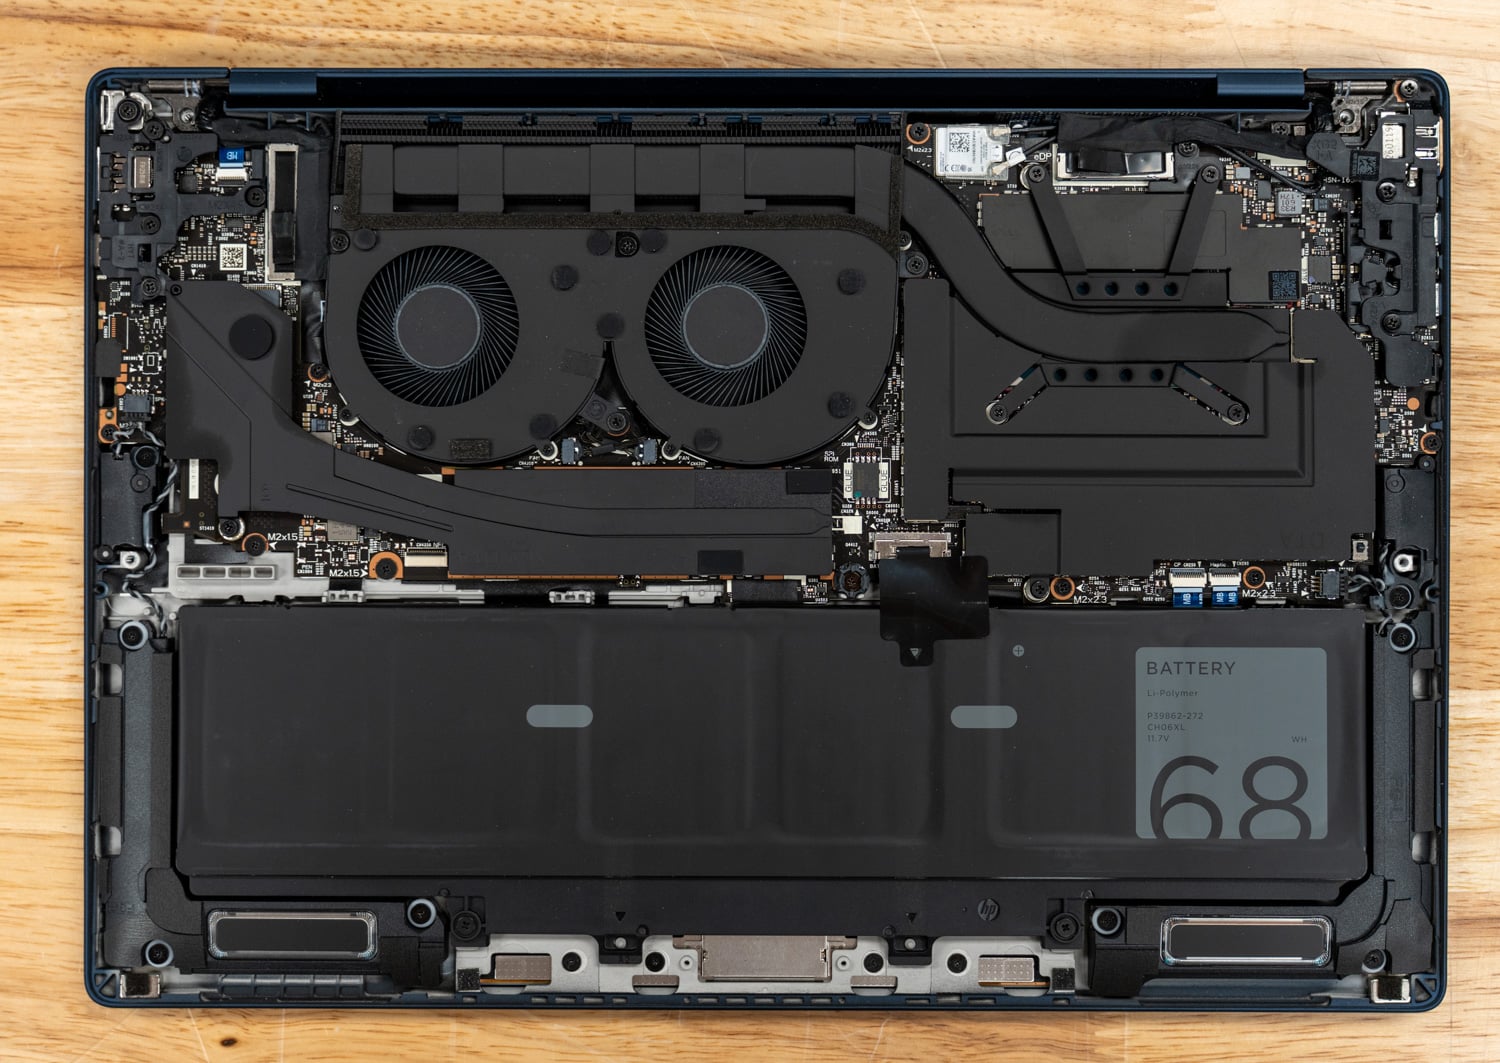
Inside, the layout is as serviceable as the keyboard story implies: two fans up top, the 68Wh Long Life 6-cell pack across the bottom, and the M.2 SSD accessible under a shield. The battery fast-charges to 50% in 30 minutes, and HP also ships a worldwide battery replacement kit for end-to-end swaps. For an IT fleet, this, plus the replaceable top-mount keyboard, is the difference between a bench repair and a chassis swap. The sustainability story runs deep: HP says 80% of the major parts contain recycled materials, down to magnesium from recycled wheel rims and carbon black from tires, and the redesigned 100W GaN adapter in our box is at least 90% recycled plastic.
HP EliteBook X G2i Performance
Our review unit runs the Core Ultra 7 366H with integrated Intel graphics, 32GB of LPDDR5X at 8533 MT/s, and a 1 TB SK hynix Gen5 SSD on Windows 11 Pro, with benchmarks tested in the Best Performance power mode. For battery life testing, we configure systems into Balanced power mode and set the screen brightness to 50%.
For comparables, we included the Dell Pro 7 14 Intel (Core Ultra 7 366H, 64GB), which runs the same processor and integrated graphics as our review unit and gives us a direct silicon-to-silicon read; the Dell Pro 5 14 Intel (Core Ultra X7 368H, Arc B390, 64GB), whose 12 Xe-core GPU is a useful proxy for the EliteBook X G2i configuration we did not test; and the Lenovo ThinkPad P14s Gen 7 (Core Ultra 7 366H, RTX PRO 1000, 64GB) as the workstation-class reference, again on the same CPU. Note that all three comparison systems have 64GB of memory compared to our unit’s 32GB, and a few comp cells are N/A where a system’s review predates a benchmark in the current suite.
PCMark 10
PCMark 10 measures general system performance across everyday work such as web browsing, video conferencing, spreadsheets, and content creation, providing a broad view of where a system’s strengths lie. Higher scores are better.
| PCMark 10 | HP EliteBook X G2i | Dell Pro 7 14 Intel | Dell Pro 5 14 Intel | Lenovo ThinkPad P14s Gen 7 |
|---|---|---|---|---|
| Overall Score | 9,209 | 8,438 | 7,945 | 9,083 |
| Essentials | 10,760 | 10,981 | 10,751 | 10,686 |
| Productivity | 18,859 | 13,992 | 13,821 | 16,501 |
| Digital Content Creation | 10,445 | 10,610 | 9,158 | 11,534 |
The overall 9,209 leads every comparison system, but the Productivity sub-score is the headline: 18,859 is the highest we have recorded in this class, 14% ahead of the ThinkPad and roughly 35% ahead of both Dell Pro machines, driven by a 23,502 spreadsheet score. Digital Content Creation lands mid-pack, which fits an 8 Xe-core iGPU against the Arc and RTX silicon in the group.
PCMark 10 Modern Office Battery
The battery test repeatedly runs common office tasks until the battery reaches the test’s cutoff point, in Balanced mode at 50% display brightness. This is a rundown of the whole system rather than a synthetic idle drain, so it tracks closely with what a full day of productivity work does to the battery. Longer runtimes are better. This table adds the EliteBook X Flip G2i, which we battery-tested specifically to isolate the display’s impact on runtime; the two systems share a platform but carry different panels.
| Modern Office Battery | HP EliteBook X G2i | HP EliteBook X Flip G2i | Dell Pro 7 14 Intel | Dell Pro 5 14 Intel | Lenovo ThinkPad P14s Gen 7 |
|---|---|---|---|---|---|
| Runtime (higher is better) | 17 hours 13 minutes | 21 hours 20 minutes* | 26 hours 18 minutes | 26 hours 48 minutes | 15 hours 52 minutes |
*The Flip result is the runtime recorded in the test log; the run ended with a benchmark error after logging 21 hours and 20 minutes.
Seventeen hours and 13 minutes clear two working days, but it sits mid-pack here: both Dell Pro machines run past 26 hours, and the Flip outlasts its own clamshell sibling by more than four hours on the same silicon. That gap is the display talking, and it is the clearest evidence in this review that panel choice is the battery decision on this platform. HP’s own workshop testing tells the same story at a larger scale: the company clocked around 31 hours of video playback on the 300-nit OLED against around 23 hours on the 500-nit panel, per HP’s internal figures.
Geekbench 6
Geekbench 6 measures processor performance using a mix of common tasks, with separate scores for single-core and multi-core workloads, plus GPU compute scores through OpenCL and Vulkan. Higher scores are better. The Dell Pro reviews predate our GPU compute captures on this test, so those cells are N/A.
| Geekbench 6 | HP EliteBook X G2i (Intel Graphics) | Dell Pro 7 14 Intel (Intel Graphics) | Dell Pro 5 14 Intel (Arc B390) | Lenovo ThinkPad P14s Gen 7 (RTX PRO 1000) |
|---|---|---|---|---|
| CPU Single-Core | 2,804 | 2,862 | 2,968 | 2,808 |
| CPU Multi-Core | 16,390 | 16,787 | 16,874 | 16,319 |
| GPU OpenCL | 24,453 | 23,741 | 32,458 | 87,537 |
| GPU Vulkan | 26,528 | 25,533 | 43,382 | 73,204 |
The three 366H systems land within 3% of each other on CPU, with the X7 368H in the Dell Pro 5 14 taking the single-core lead. The review unit’s integrated graphics turn in 24,453 in OpenCL and 26,528 in Vulkan, numbers that the RTX PRO 1000 more than triples; within integrated silicon, they are exactly where this iGPU should sit.
Geekbench 7
Geekbench 7 joins the suite alongside Geekbench 6 as comparison data accumulates. It uses updated workloads and a rebased scoring range, so results are not comparable between the two versions. Higher scores are better.
| Geekbench 7 | HP EliteBook X G2i (Intel Graphics) | Dell Pro 7 14 Intel (Intel Graphics) | Dell Pro 5 14 Intel (Arc B390) | Lenovo ThinkPad P14s Gen 7 (RTX PRO 1000) |
|---|---|---|---|---|
| CPU Single-Core | 2,527 | 2,589 | 2,701 | 2,533 |
| CPU Multi-Core | 17,345 | 17,805 | 18,737 | 17,651 |
| GPU OpenCL | 23,737 | 23,876 | 54,664 | 75,340 |
| GPU Vulkan | 23,036 | 23,484 | 47,233 | 70,067 |
The silicon-to-silicon read is tight: 2,527 and 17,345 against the Dell Pro 7 14’s 2,589 and 17,805 on the same processor, and the two integrated GPUs land within 2% of each other in both APIs. The Arc B390 in the Dell Pro 5 14 more than doubles both iGPU compute scores, which is the cleanest preview of what the untested X7 358H EliteBook config would add.
Cinebench 2026
Cinebench 2026 is the current release in the Cinebench line and the only version we report. It tests CPU and GPU performance using Maxon’s Redshift render engine, built on the latest Cinema 4D code. Because code and compiler changes accelerated scene rendering, scores use an adjusted range and should not be compared to previous Cinebench versions. Its GPU test does not run on Intel integrated graphics, so only the discrete-GPU ThinkPad posts a GPU score here.
| Cinebench 2026 | HP EliteBook X G2i | Dell Pro 7 14 Intel | Dell Pro 5 14 Intel | Lenovo ThinkPad P14s Gen 7 |
|---|---|---|---|---|
| CPU Single Thread | 494 | 511 | 530 | 502 |
| CPU Multiple Threads | 4,060 | 3,807 | 3,656 | 4,492 |
| GPU | N/A | N/A | N/A | 34,437 |
The review unit posts the best multi-thread result of the three integrated systems at 4,060, 7% ahead of the same-CPU Dell Pro 7 14, though the RTX-cooled ThinkPad still leads at 4,492. Single-thread runs the other way, with the EliteBook at the back of a pack separated by 7%.
3DMark CPU Profile
3DMark CPU Profile measures CPU performance at fixed thread counts, showing how a system scales from single-threaded work up to full saturation. Higher scores are better. The Dell Pro reviews predate this test in our suite, so their cells are N/A.
| 3DMark CPU Profile | HP EliteBook X G2i | Dell Pro 7 14 Intel | Dell Pro 5 14 Intel | Lenovo ThinkPad P14s Gen 7 |
|---|---|---|---|---|
| Max Threads | 9,179 | 9,699 | 10,370 | 10,500 |
| 16 Threads | 8,995 | 9,679 | 10,355 | 10,421 |
| 8 Threads | 5,814 | 6,450 | 6,669 | 6,550 |
| 4 Threads | 3,812 | 4,240 | 4,256 | 4,219 |
| 2 Threads | 2,095 | 2,230 | 2,269 | 2,251 |
| 1 Thread | 1,108 | 1,163 | 1,181 | 1,165 |
Scaling is orderly from 1,108 at one thread to 9,179 at max threads, but the ThinkPad leads at every step on the same processor, by 13% at full saturation. Sustained-load thermal headroom is the likely difference between a 3-pound business chassis and a thicker workstation build.
7-Zip Compression
The built-in 7-Zip benchmark measures how quickly the processor can compress and decompress data using multiple threads, run with a 128MB dictionary across ten passes. Higher GIPS scores are better. The Dell Pro reviews recorded only the total rating, so their compression and decompression cells are N/A.
| 7-Zip 24.09 (GIPS) | HP EliteBook X G2i | Dell Pro 7 14 Intel | Dell Pro 5 14 Intel | Lenovo ThinkPad P14s Gen 7 |
|---|---|---|---|---|
| Compressing | 89.259 | 83.281 | 93.417 | 90.364 |
| Decompressing | 86.189 | 76.774 | 89.181 | 90.526 |
| Total Rating | 87.724 | 80.027 | 91.299 | 90.445 |
A total rating of 87.724 GIPS beats the same-CPU Dell Pro 7 14 by 8% and lands within 3% of the group-leading ThinkPad. For a 32GB system against 64GB comps, memory capacity clearly is not the constraint in this workload.
y-cruncher
y-cruncher measures how quickly the processor can calculate a large number of digits of Pi, placing a heavy load on the CPU and memory subsystem, while the BBP extracts hexadecimal digits of Pi. Results are in seconds, so lower times are better. The review unit could not run the 5-billion-digit computation because it exceeded the 32GB of memory, but in the lower tests, it held its own against the Dell units.
| y-cruncher (seconds, lower is better) | HP EliteBook X G2i | Dell Pro 7 14 Intel | Dell Pro 5 14 Intel | Lenovo ThinkPad P14s Gen 7 |
|---|---|---|---|---|
| Pi 1B | 34.920 | 34.775 | 29.405 | 26.685 |
| Pi 2.5B | 97.527 | 104.586 | 90.719 | 76.787 |
| Pi 5B | N/A | 240.554 | 204.685 | 172.994 |
| Pi BBP 1B | 1.842 | 1.835 | 1.718 | 1.621 |
| Pi BBP 10B | 22.451 | 21.280 | 20.212 | 18.200 |
| Pi BBP 100B | 269.011 | 301.611 | 256.416 | 219.969 |
At 1 billion digits, the review unit and the Dell Pro 7 14 are separated by a rounding error, which is what identical silicon should do. The 5B row is the one to notice: this is the first concrete cost of the 32GB configuration in this review, a workload the 64GB comps simply complete, and this machine cannot start.
Blender
The Blender benchmark measures rendering performance using three different 3D scenes: Monster, Junkshop, and Classroom. Results are reported in samples per minute, so higher scores are better. We test on the CPU and GPU. Scores are not comparable across Blender versions, so we report the scores for the current 5.2 release here.
| Blender 5.2 (samples/min) | HP EliteBook X G2i (Intel Graphics) | Dell Pro 7 14 Intel (Intel Graphics) | Dell Pro 5 14 Intel (Arc B390) | Lenovo ThinkPad P14s Gen 7 (RTX PRO 1000) |
|---|---|---|---|---|
| GPU | ||||
| Monster | 250.14 | 254.40 | 560.28 | 922.95 |
| Junkshop | 154.95 | 189.59 | 466.36 | 795.65 |
| Classroom | 149.90 | 152.73 | 414.57 | 625.62 |
| CPU | ||||
| Monster | 118.87 | 107.87 | 129.61 | 131.08 |
| Junkshop | 84.95 | 78.06 | 90.52 | 97.76 |
| Classroom | 57.45 | 53.90 | 62.20 | 68.45 |
GPU rendering tracks the silicon exactly: 250 samples per minute on Monster against 254 for the same iGPU in the Dell Pro 7 14, while the Arc B390 in the Dell Pro 5 14 renders at 2.2 times that rate and the RTX PRO 1000 at 3.7 times. CPU rendering is more flattering, with the review unit ahead of its silicon twin on all three scenes.
LuxMark
LuxMark is an OpenCL rendering benchmark built on LuxCoreRender, run on the Hall and Food scenes. Higher scores are better.
| LuxMark v4 | HP EliteBook X G2i | Dell Pro 7 14 Intel | Dell Pro 5 14 Intel | Lenovo ThinkPad P14s Gen 7 |
|---|---|---|---|---|
| Hall | 2,481 | 2,168 | 3,287 | 11,342 |
| Food | 1,058 | 880 | 1,585 | 4,103 |
Hall at 2,481 and Food at 1,058 put the review unit 14% and 20% ahead of the same-CPU Dell Pro 7 14, with the usual integrated-versus-discrete gulf beyond that: the Arc B390 adds roughly a third again, and the ThinkPad’s RTX PRO 1000 is in a different category entirely.
V-Ray
V-Ray measures GPU path-tracing performance in vpaths using Chaos’ production renderer. Higher is better. The RTX engine requires NVIDIA hardware, so only the ThinkPad posts a score there.
| V-Ray GPU (vpaths) | HP EliteBook X G2i | Dell Pro 7 14 Intel | Dell Pro 5 14 Intel | Lenovo ThinkPad P14s Gen 7 |
|---|---|---|---|---|
| CUDA Engine | 850 | 775 | 919 | 1,568 |
| RTX Engine | N/A | N/A | N/A | 2,589 |
The 850 vpaths through the CUDA-compatible path are 10% up on the silicon twin and 8% behind the Arc B390. As with every GPU render test in this review, the class jump is from the discrete card to the integrated tier, not the other way around.
Blackmagic RAW Speed Test
The Blackmagic RAW Speed Test measures how quickly a system can decode Blackmagic RAW footage on the CPU and GPU, reported in frames per second at 8K with 12:1 compression. Higher is better. The Dell Pro reviews predate this test in our suite, so their cells are N/A.
| Blackmagic RAW Speed Test | HP EliteBook X G2i | Dell Pro 7 14 Intel | Dell Pro 5 14 Intel | Lenovo ThinkPad P14s Gen 7 |
|---|---|---|---|---|
| 8K 12:1 CPU (fps) | 72 | 68 | 76 | 77 |
| 8K 12:1 GPU (fps) | 48 | 48 | 86 | 96 |
CPU decode at 72fps sits just behind the ThinkPad’s 77, while the GPU path at 48fps is half the RTX PRO 1000’s rate. For proxy-free 8K editing, this is a machine that leans on its CPU.
Topaz Video AI
The Topaz Video AI benchmark measures AI video upscaling and frame-interpolation performance in frames per second across the application’s enhancement models, run at 1080p input, where higher is better. The 16X Slowmo Aion model failed to complete on the review unit, the same failure we have recorded on other Intel integrated graphics systems.
| Topaz Video AI (fps) | HP EliteBook X G2i | Dell Pro 7 14 Intel | Dell Pro 5 14 Intel (Arc B390) | Lenovo ThinkPad P14s Gen 7 (RTX PRO 1000) |
|---|---|---|---|---|
| Artemis 1X / 2X / 4X | 2.45 / 2.48 / 0.91 | 2.51 / 2.53 / 0.95 | 6.27 / 5.23 / 1.88 | 5.17 / 3.19 / 1.12 |
| Iris 1X / 2X / 4X | 2.44 / 1.40 / 0.43 | 2.38 / 1.37 / 0.42 | 5.06 / 3.10 / 0.93 | 5.91 / 3.12 / 1.01 |
| Proteus 1X / 2X / 4X | 2.59 / 2.86 / 1.11 | 2.52 / 2.76 / 1.06 | 6.37 / 6.03 / 2.42 | 4.78 / 3.14 / 1.05 |
| Gaia 1X / 2X / 4X | 1.34 / 0.91 / 0.69 | 1.31 / 0.89 / 0.67 | 3.27 / 2.24 / 1.47 | 1.62 / 1.13 / 0.79 |
| Nyx 1X / 2X | 0.72 / 0.72 | 0.71 / 0.71 | 1.56 / 1.52 | 2.40 / 2.09 |
| Hyperion HDR 1X | 2.08 | 2.02 | 3.13 | 14.56 |
| 4X Slowmo Apollo / APFast | 4.61 / 16.06 | 3.08 / 14.64 | 8.52 / 24.27 | 10.39 / 29.94 |
| 16X Slowmo Aion | DNF | DNF | DNF | N/A |
The review unit and the Dell Pro 7 14 move in lockstep across every model, usually within a few hundredths of a frame, which is silicon parity on display. The Arc B390 roughly doubles throughput on the enhancement models, and the Aion interpolation failure remains an Intel iGPU pattern rather than an HP problem.
UL Procyon AI Text Generation
The Procyon AI Text Generation benchmark measures local LLM inference across four models of increasing size—Phi, Mistral, Llama3, and Llama2—run here using OpenVINO on the integrated GPU. The Pro 5 14 does bring a higher-class CPU than the other comparisons, as well as a higher-class iGPU, but we will have to see how it stands against the RTX PRO 1000 that the ThinkPad P14s Gen 7 brings. When testing the RTX PRO 1000, we have to use a different inference engine: ONNX Runtime, as OpenVINO is Intel-only. Higher scores are better.
| Procyon AI Text Generation | HP EliteBook X G2i | Dell Pro 7 14 Intel | Dell Pro 5 14 Intel | Lenovo ThinkPad P14s Gen 7 (IGPU / RTX PRO 1000) |
|---|---|---|---|---|
| Phi | 1,082 | 1027 | 1772 | 1071 / 1,618 |
| Mistral | 1,053 | 1027 | 1767 | 1058 / 1,397 |
| Llama3 | 952 | 1014 | 1741 | 1047 / 1,252 |
| Llama2 | 993 | 1009 | 1731 | 1012 / DNF |
We see a pretty tight comparison with the same silicon in the Dell Pro 7 14, with a 55-point gap on Phi and a 26-point gap on Mistral. Llama 3 widens the gap in the other direction, favoring Dell with a 62-point lead and a 16-point lead over Llama 2. The Pro 5 14 leads the comparison group by a wide margin, helped by its higher-class CPU and iGPU, and even outpaces the RTX PRO 1000 in this test. That result likely reflects the Arc B390’s unified memory setup compared with the dedicated VRAM available to the RTX GPU.
UL Procyon AI Image Generation
The Procyon AI Image Generation benchmark measures local Stable Diffusion inference, run here through OpenVINO on the integrated GPU. The INT8 test uses the quantized SD 1.5 model. Higher scores are better.
| Procyon AI Image Generation | HP EliteBook X G2i | Dell Pro 7 14 Intel | Dell Pro 5 14 Intel (Arc B390) | Lenovo ThinkPad P14s Gen 7 (RTX PRO 1000) |
|---|---|---|---|---|
| SD 1.5 FP16 | 258 | 258 | 635 | 943 |
| SD 1.5 INT8 | 3,529 | 3,575 | 7,693 | 12,403 |
| SDXL FP16 | 307 | 268 | 646 | 765 |
SD 1.5 FP16 returns 258, matching the Dell Pro 7 14 to the point, and INT8 lands within 1.3%. Just like above, the Dell Pro 5 14 brings a bit of a performance boost with its higher-class iGPU, and the ThinkPad P14s Gen 7 shows off its RTX PRO 1000.
UL Procyon AI Computer Vision
The Procyon AI Computer Vision benchmark measures inference performance across a range of neural networks, including MobileNet V3, ResNet 50, Inception V4, YOLO V3, DeepLab V3, and REAL-ESRGAN. The WinML runs use float32 on CPU and GPU, giving a like-for-like view across vendors. Higher scores are better.
| Procyon AI Computer Vision (WinML) | HP EliteBook X G2i | Dell Pro 7 14 Intel | Dell Pro 5 14 Intel | Lenovo ThinkPad P14s Gen 7 |
|---|---|---|---|---|
| CPU | 126 | 121 | 119 | 134 |
| GPU | 205 | 205 | 398 | 426 |
In the computer vision test, we see tight comparisons again with 126 on CPU and 205 on GPU, almost matching the Dell Pro 7 14’s 121 on CPU and 205 on GPU scoring. It still comes in behind the Dell Pro 5 14 and the Lenovo, which have better GPUs, but the CPU scores were all within 15 points of each other.
SPECviewperf 15
SPECviewperf 15 measures graphics performance using viewsets derived from professional applications in CAD, 3D modeling, rendering, engineering, and medical visualization, replayed here at 1080p. Higher scores are better, although this is a business notebook rather than a certified workstation, so these results are context rather than a purchase criterion.
| SPECviewperf 15 (FHD) | HP EliteBook X G2i | Dell Pro 7 14 Intel | Dell Pro 5 14 Intel (Arc B390) | Lenovo ThinkPad P14s Gen 7 (RTX PRO 1000) |
|---|---|---|---|---|
| 3dsmax-08 | 8.70 | 9.58 | 20.21 | 28.20 |
| blender-01 | 9.26 | 9.11 | 21.19 | 40.69 |
| catia-07 | 5.66 | 5.27 | 10.27 | 43.36 |
| creo-04 | 18.85 | 18.27 | 32.53 | 107.59 |
| energy-04 | 3.62 | 3.68 | 10.78 | 45.79 |
| enscape-01 | 6.29 | 6.22 | 14.28 | 25.45 |
| maya-07 | 52.56 | 49.54 | 82.42 | 112.84 |
| medical-04 | 9.97 | 9.91 | 22.96 | 86.38 |
| snx-05 | 37.45 | 37.74 | 46.22 | 103.61 |
| solidworks-08 | 12.37 | 11.86 | 23.60 | 53.63 |
| unreal_engine-01 | 21.47 | 21.36 | 38.77 | 49.24 |
The review unit and the Dell Pro 7 14 are within a few percent across all 11 viewsets, another clean silicon match. The Arc B390 roughly doubles most viewsets, and the RTX PRO 1000 runs far ahead, which is the certified-workstation premium in one table.
SPECworkstation 4
SPECworkstation 4 measures workstation performance across CPU, graphics, storage, AI, and industry-vertical workloads using real applications. Higher scores are better, and N/A means the system did not complete all workloads required for that category, while DNF indicates a failed workload.
| SPECworkstation 4 | HP EliteBook X G2i | Dell Pro 7 14 Intel | Dell Pro 5 14 Intel | Lenovo ThinkPad P14s Gen 7 |
|---|---|---|---|---|
| Hardware Subsystems | ||||
| CPU | 1.16 | 1.08 | 1.19 | 1.35 |
| Graphics | 0.80 | 0.82 | 1.68 | 4.51 |
| Accelerator | 1.46 | N/A | N/A | 3.26 |
| Storage | 1.65 | 1.68 | 1.76 | 1.67 |
| Industry Verticals | ||||
| AI & Machine Learning | 1.16 | 1.18 | 1.36 | 1.65 |
| Energy | 1.02 | 0.90 | 1.18 | 1.69 |
| Financial Services | 0.79 | 0.78 | 0.78 | 0.96 |
| Life Sciences | 1.14 | 1.04 | 1.34 | 1.82 |
| Media & Entertainment | 1.24 | 1.16 | DNF | 1.81 |
| Product Design | 1.47 | 1.41 | 1.64 | 1.89 |
| Productivity & Development | 0.93 | 1.04 | 1.10 | 1.34 |
The review unit completed all 23 workloads cleanly, including the 7-Zip workload that has recently tripped several systems in our lab. The scores themselves tell the business-laptop story: competitive CPU and storage subsystems, a 0.80 graphics subsystem reflecting the 8 Xe cores, and an Accelerator score of 1.46 from the NPU that neither Dell Pro nor the original run captured.
Storage Performance
We measure storage with 3DMark’s Storage benchmark, which replays real-world gaming and content traces, and the Blackmagic Disk Speed Test for sequential throughput. Higher is better for both.
| Storage | HP EliteBook X G2i | Dell Pro 7 14 Intel | Dell Pro 5 14 Intel | Lenovo ThinkPad P14s Gen 7 |
|---|---|---|---|---|
| 3DMark Storage | 3,156 | 3,259 | 3,144 | 3,094 |
| Blackmagic Write (MB/s) | 8,949.2 | 8,934.5 | 8,747.3 | 8,262.3 |
| Blackmagic Read (MB/s) | 7,919.3 | 8,398.6 | 8,609.6 | 8,511.5 |
The SK hynix Gen5 drive writes at 8,949 MB/s, the fastest in the group, and its 3DMark Storage score of 3,156 sits in the middle of a tightly packed field. Sequential read at 7,919 MB/s trails the comps by 6 to 8%, a gap nobody outside a synthetic benchmark will feel.
Conclusion
Through performance testing, the EliteBook X G2i held its own against the Dell Pro 7 14 on the same silicon, ahead in Cinebench 2026 multi-thread and LuxMark, and a step behind in Geekbench 7, while coming in meaningfully lighter. Battery life trailed the LCD-equipped Pro 7 14 at 17 hours 13 minutes versus 26:18, but most of that gap is due to the 3K OLED panel’s power draw. The 32GB LPDDR5x configuration cost it a little in memory-bound workloads, where the largest y-cruncher runs were out of reach; a 64GB option is available in the lineup for buyers who need the headroom.
For buyers who want more graphics, HP offers the Core Ultra X7 358H with Arc B390 graphics in this same chassis, a 12 Xe-core tier that should land close to the Dell Pro 5 14 columns in our charts, since both carry the same CPU and GPU package. As it happens, that is also the build HP is actually selling: with no configurator live, the closest in-stock clamshell to our unit is the B390 version with the same 32GB, 1TB, and 3K OLED fit-out at $3,399 on sale, while the Flip variant of our 366H configuration runs $2,999.
Our one real gripe on the build is lid flex. Pressing the center of the closed lid produces noticeable give that competitors, and even the Flip counterpart, resist better, though opening the lid from a single corner shows little deflection. Beyond that, the chassis feels premium, and the machine is comfortable to work on.
The EliteBook X G2i runs head-to-head with heavier competition in a 2.4-pound package with a respectable port selection, and HP’s repairability work deserves the call-out: the keyboard comes out from the top without screws, and the battery swap is also easy. For buyers who want a serviceable, genuinely light business machine with a panel worth looking at all day— and even three color options—this is a solid choice.
For configuration options and current pricing, visit the HP EliteBook X G2i product page.
Leaderboard: The HP EliteBook X G2i enters our Laptop Battery Life Leaderboard at #9 with 17 hr 13 min, its Flip sibling enters at #7 with 21 hr 20 min, and it takes Best Executive Thin-and-Light on the Best Business Laptops leaderboard.


 Amazon