

The Dell Pro Precision 5 16s AMD brings the Ryzen AI 9 HX PRO 475 into Dell’s larger 16-inch mobile workstation chassis, pairing 12 cores and 24 threads with Radeon 890M graphics and a 60 TOPS NPU. Our review unit adds 64GB of LPDDR5x memory, a 1 TB PCIe Gen4 SSD, and a 2560 x 1600 120Hz IPS display. It is the fourth Pro Precision 5 configuration we have tested across the 14-inch and 16-inch models, giving us a direct look at how AMD’s platform changes when it has a larger chassis to work with.
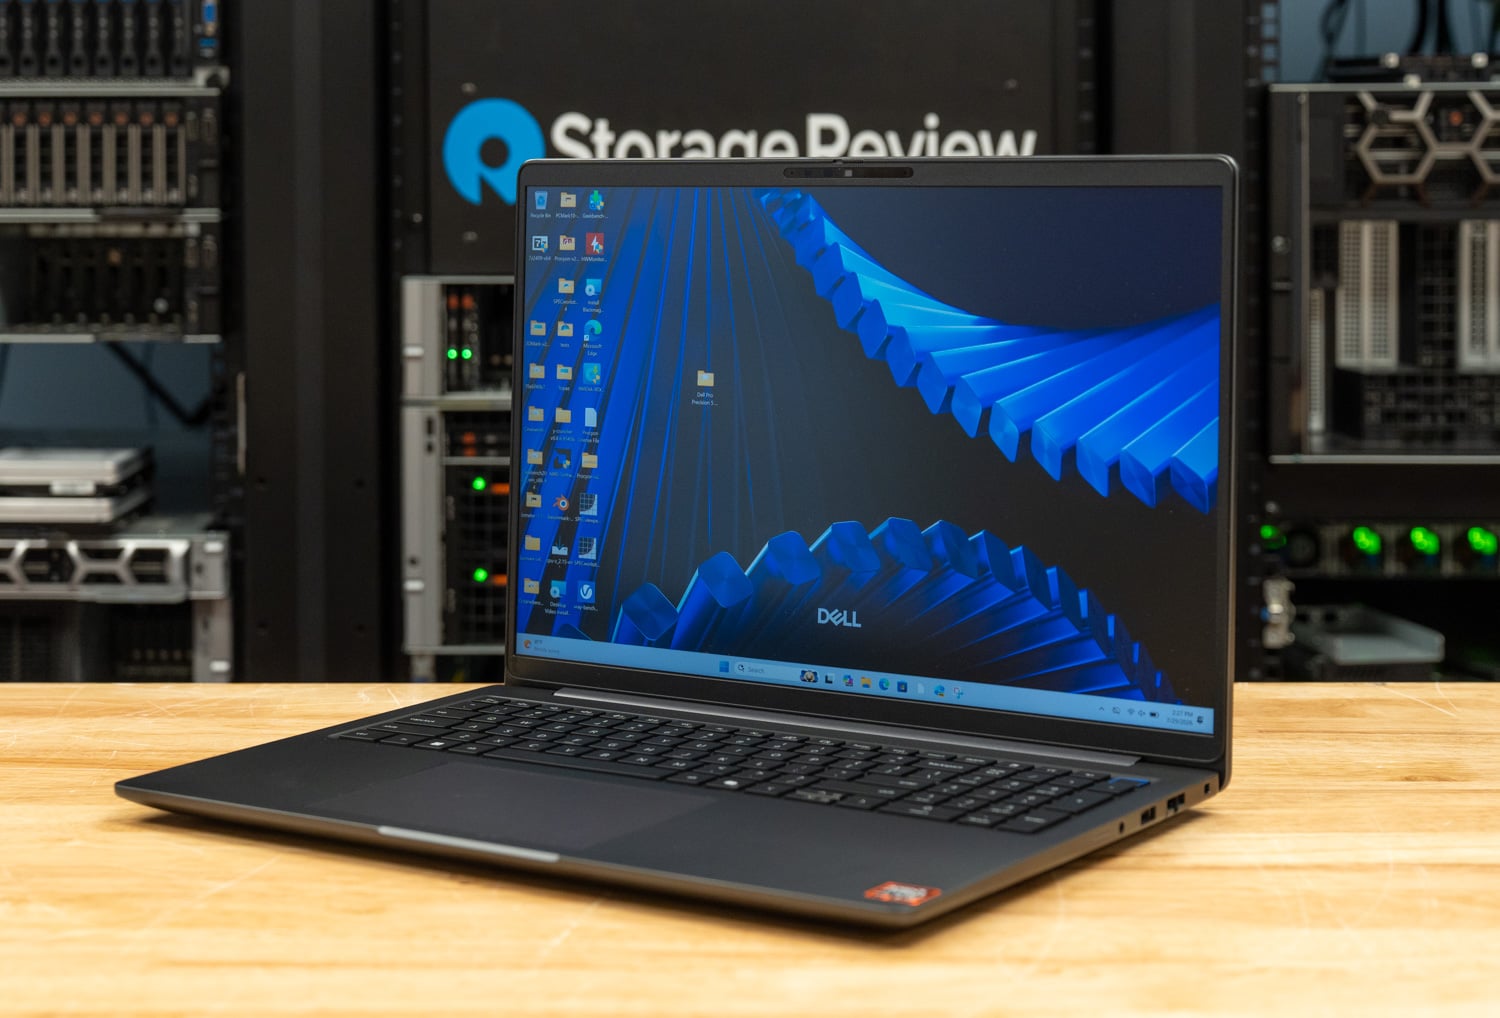
Moving from the 14s AMD to the 16s changes quite a bit around the same Ryzen AI 9 HX PRO 475 and Radeon 890M platform. The larger model starts at 4.17 lb compared with 3.08 lb for the 14s, but it adds a 16-inch QHD+ 120Hz display, a full numeric keypad, and more internal room for cooling. That extra thermal headroom becomes useful for several sustained CPU workloads later in testing, while graphics performance generally stays close to 14s because both use the same Radeon 890M.
The Dell Pro Precision 5 16s AMD currently starts at $2,118.70 on Dell.com. Recreating our review hardware with the Ryzen AI 9 HX PRO 475, 64GB of memory, 1 TB Gen4 SSD, QHD+ 120Hz display, Mini-LED keyboard, 70Wh battery, 100W adapter, and fingerprint and smart-card security package comes to approximately $5,087 with the current listed hardware upgrades. Configuration changes can also affect support pricing, so treat this as an approximate single-unit web price rather than a fixed commercial purchase price.
Dell Pro Precision 5 16s AMD Specifications
| Specification | Dell Pro Precision 5 16s AMD (PW516265) |
|---|---|
| Processor | AMD Ryzen AI 9 HX PRO 475 (12 cores/24 threads, up to 5.2GHz, 36MB cache, 60 TOPS NPU) |
| Graphics | AMD Radeon 890M (integrated) |
| Memory | 64GB LPDDR5x, 8533 MT/s rated, dual-channel, non-ECC |
| Storage | 1TB SSD, PCIe Gen4 SanDisk PC_SN7100S |
| Display | 16-inch QHD+/WQXGA (2560 x 1600), non-touch, 120Hz, 500 nits, IPS, 100% sRGB, anti-glare |
| Camera | 8MP HDR RGB + IR with User Presence Detection |
| Wireless | MediaTek Wi-Fi 7 MT7925, 2×2, Bluetooth 5.4 |
| Keyboard | English US Mini-LED backlit keyboard with numeric keypad and Copilot key |
| Security | Fingerprint reader, smart card reader, ControlVault 3+, TPM 2.0, FIPS 140-3 certified |
| Battery | 3-cell, 70Wh Long Lifecycle, ExpressCharge and ExpressCharge Boost |
| Power | 100W USB-C adapter |
| Operating System | Windows 11 Pro (Copilot+ PC) |
| Chassis | Aluminum alloy, Graphite |
| Dimensions | 14.12 x 9.98 in, 0.43 to 0.79 in thick; starting at 4.17 lb (1.89 kg) |
| Warranty | 36 months ProSupport Next Business Day Onsite Service after Remote Diagnosis with hardware and software support |
| Price | $2,118.70 starting / approximately $5,087 as configured |
Build and Design
The Pro Precision 5 16s AMD uses the same general chassis design as the Intel 16s, with an aluminum-alloy exterior finished in Dell’s dark Graphite. At 14.12 x 9.98 inches and starting at 4.17 lb, it is noticeably larger than the 14s AMD but still relatively thin for a 16-inch business workstation. The wider chassis gives Dell room for a larger display, a full numeric keypad, a 70Wh battery, and a good selection of built-in ports, while security options include fingerprint authentication, a smart-card reader, TPM 2.0, and an 8MP IR camera.
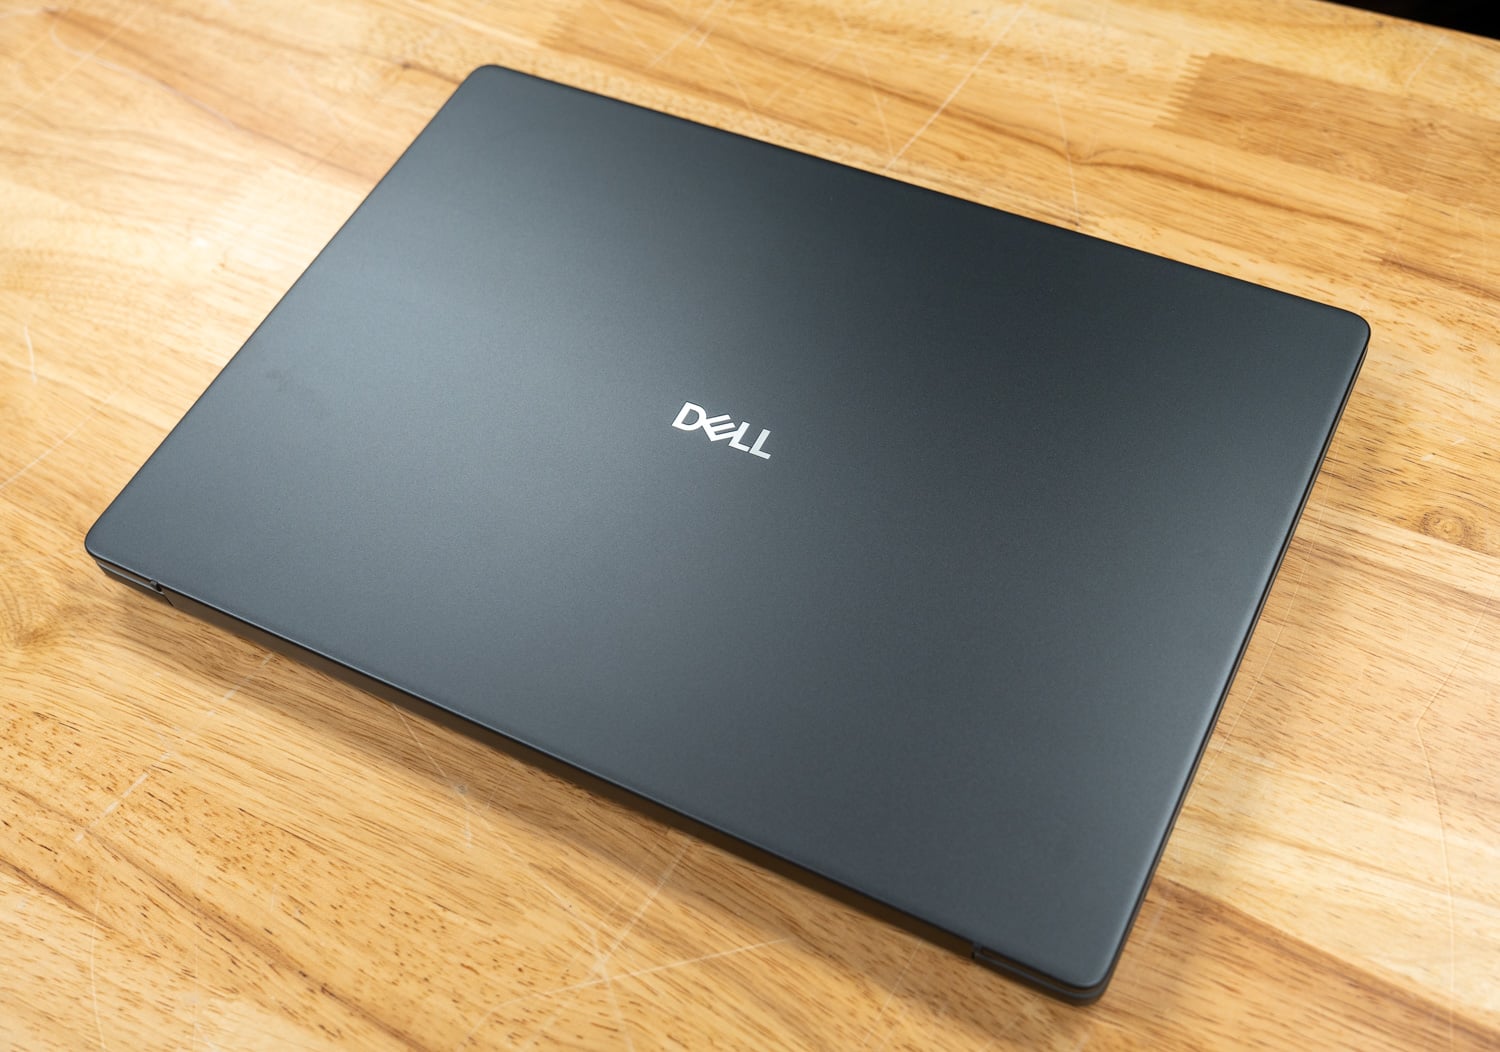
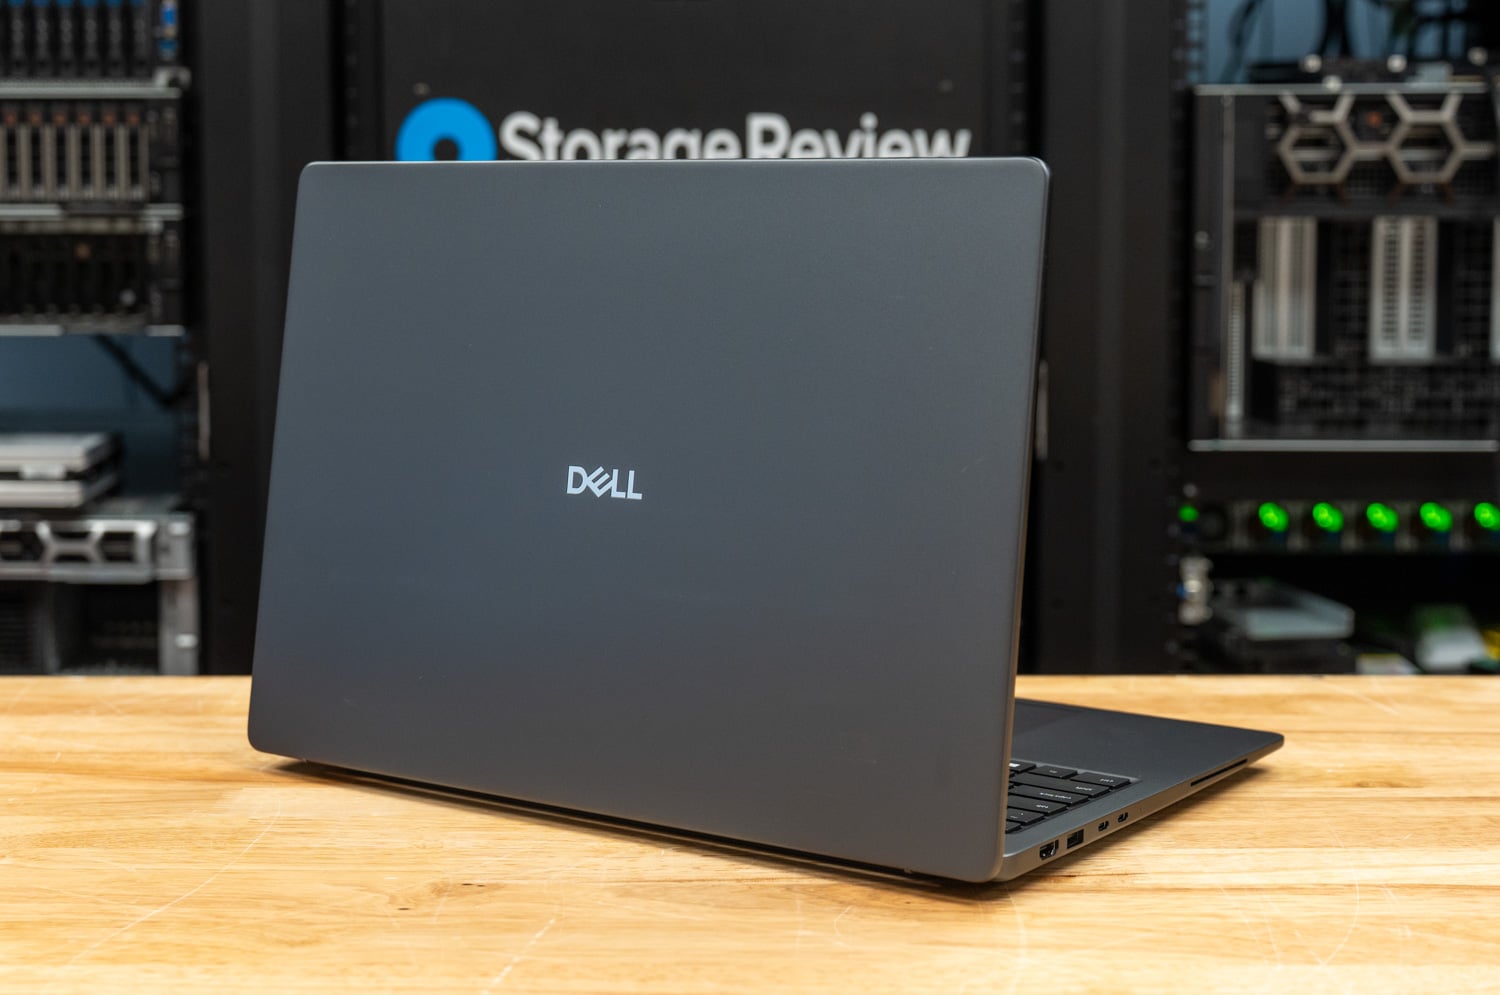
The Graphite aluminum top cover keeps the exterior simple, with only the centered Dell logo on the matte finish. The lid is rigid enough that the large 16-inch panel does not look overly flexible when opening or carrying the notebook, while the rounded corners and tapered edges help keep the wider chassis from looking too bulky. So, at a glance, very little separates the AMD model from the Intel 16s, aside from the AMD badge on the keyboard deck once you open it up.
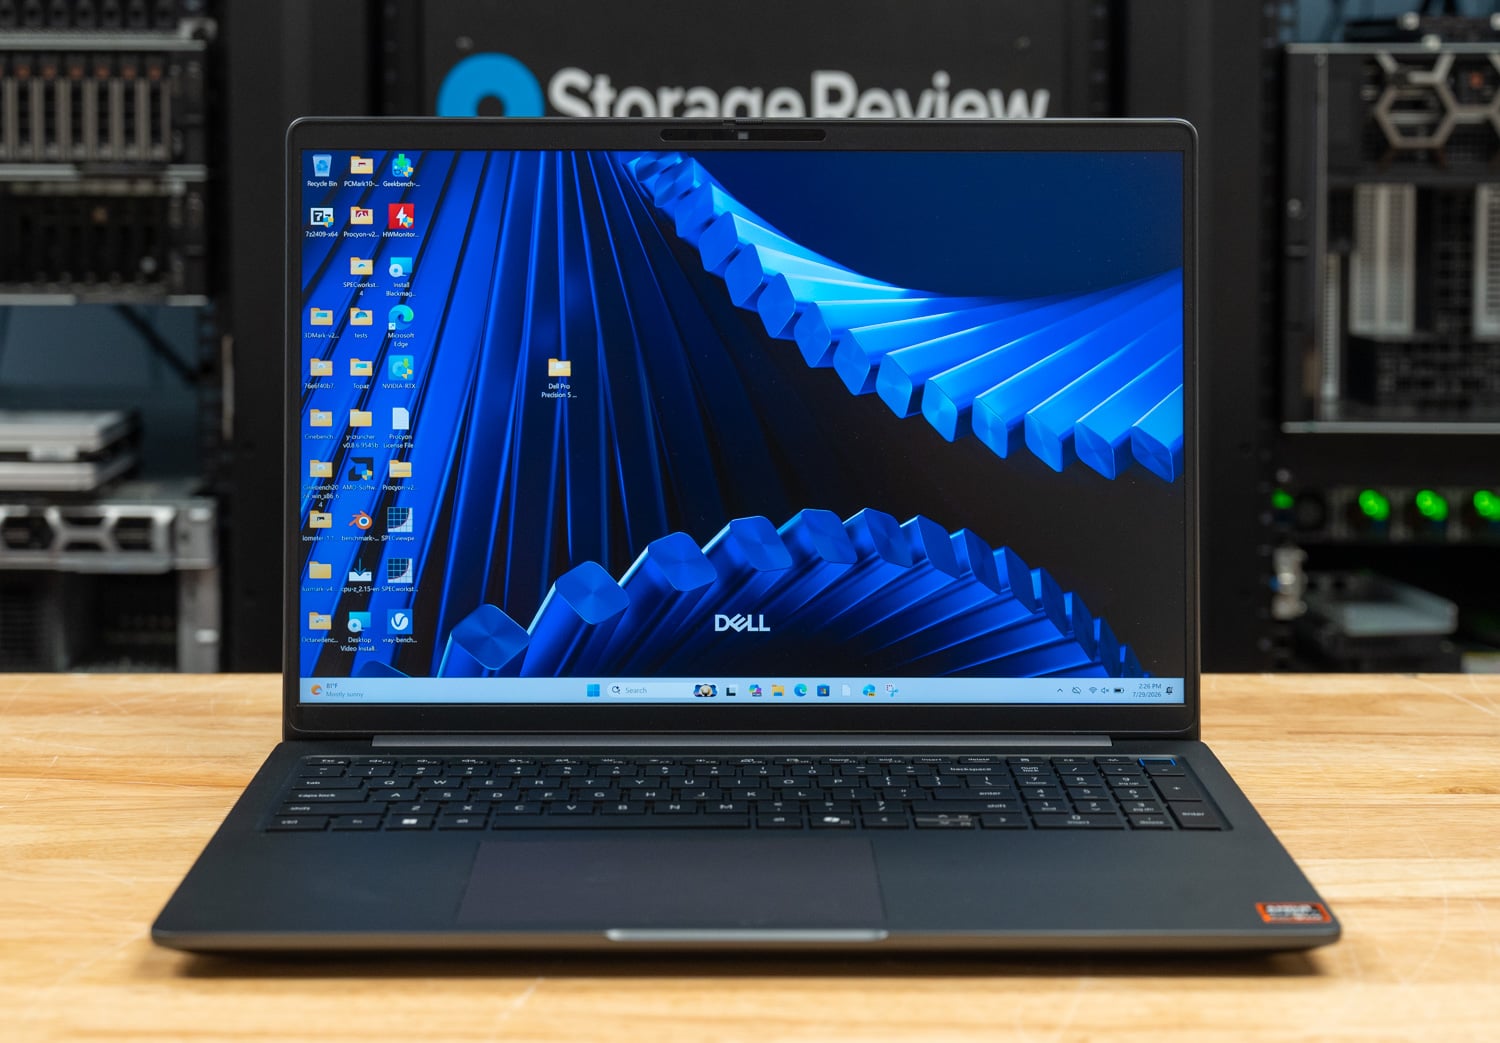
The 16-inch 2560 x 1600 IPS display made day-to-day use much nicer. The 16:10 aspect ratio provides much more room to work with than the 14s, especially for spreadsheets, development tools, or anything with a busy interface, and I found the 500-nit brightness more than adequate indoors. The 120Hz refresh rate also makes scrolling and general navigation feel noticeably smoother, while the anti-glare finish kept reflections to a minimum in our lab.
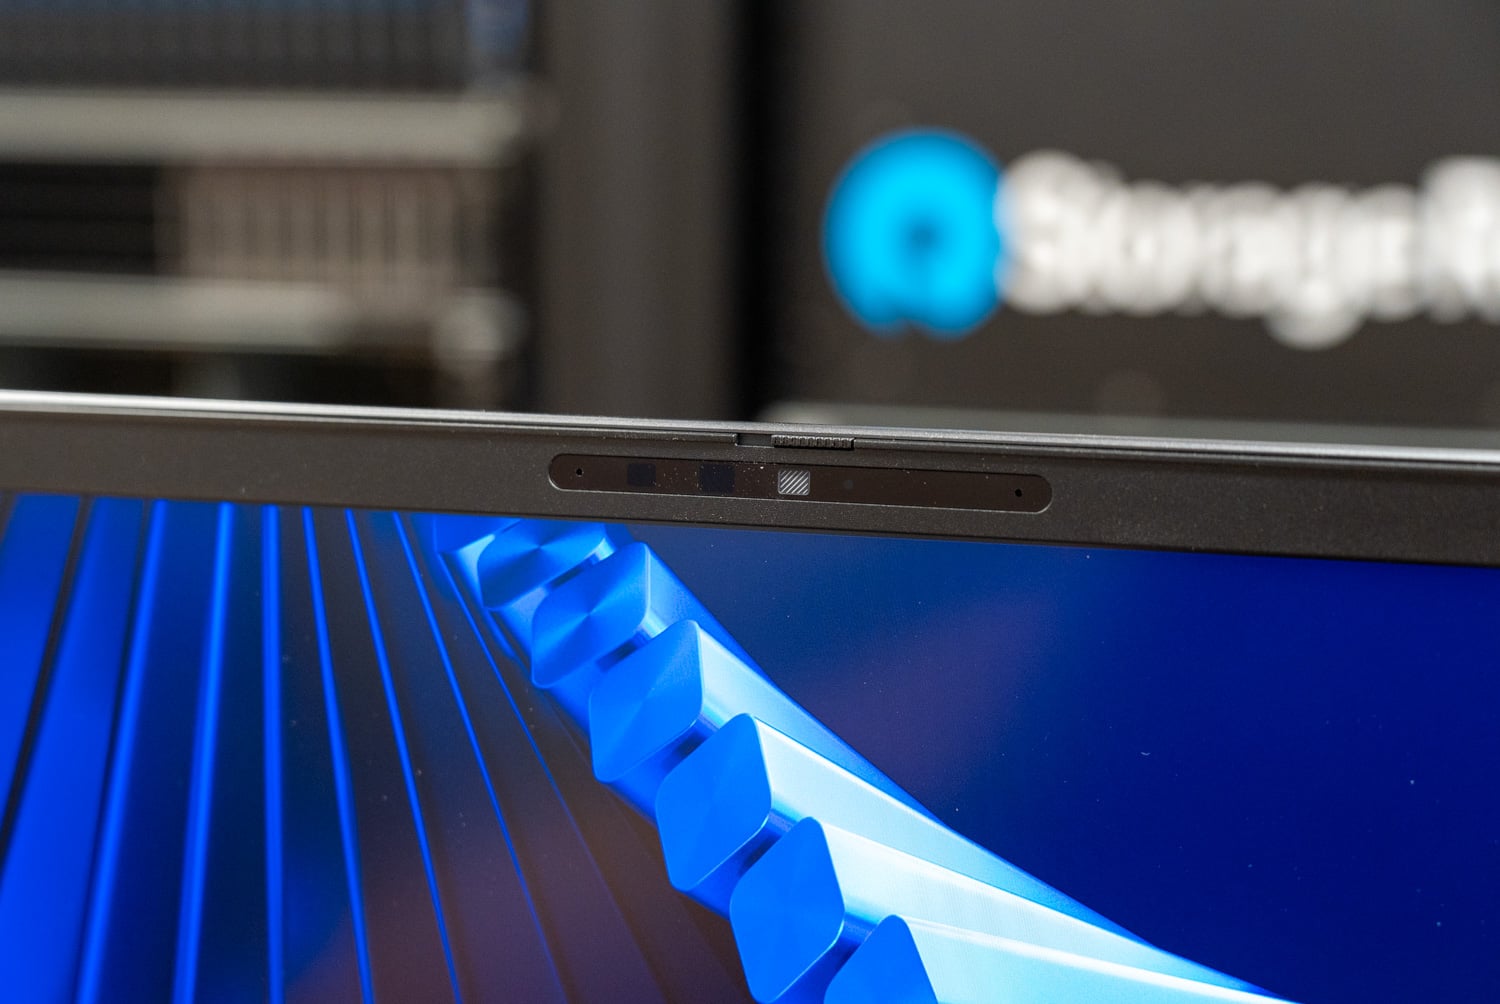
The 8MP HDR RGB and IR camera is centered in the upper bezel and includes a physical privacy shutter, Windows Hello support, and User Presence Detection. The privacy shutter is a small mechanical cover that physically blocks the camera lens when closed, so it doesn’t rely on software to disable the webcam. That is especially useful in business environments, while traveling, or in private settings because it lets you immediately see whether the camera is blocked. The IR hardware supports facial authentication through Windows Hello, while User Presence Detection can work with supported Windows features to lock the notebook when you walk away and wake it when you return.
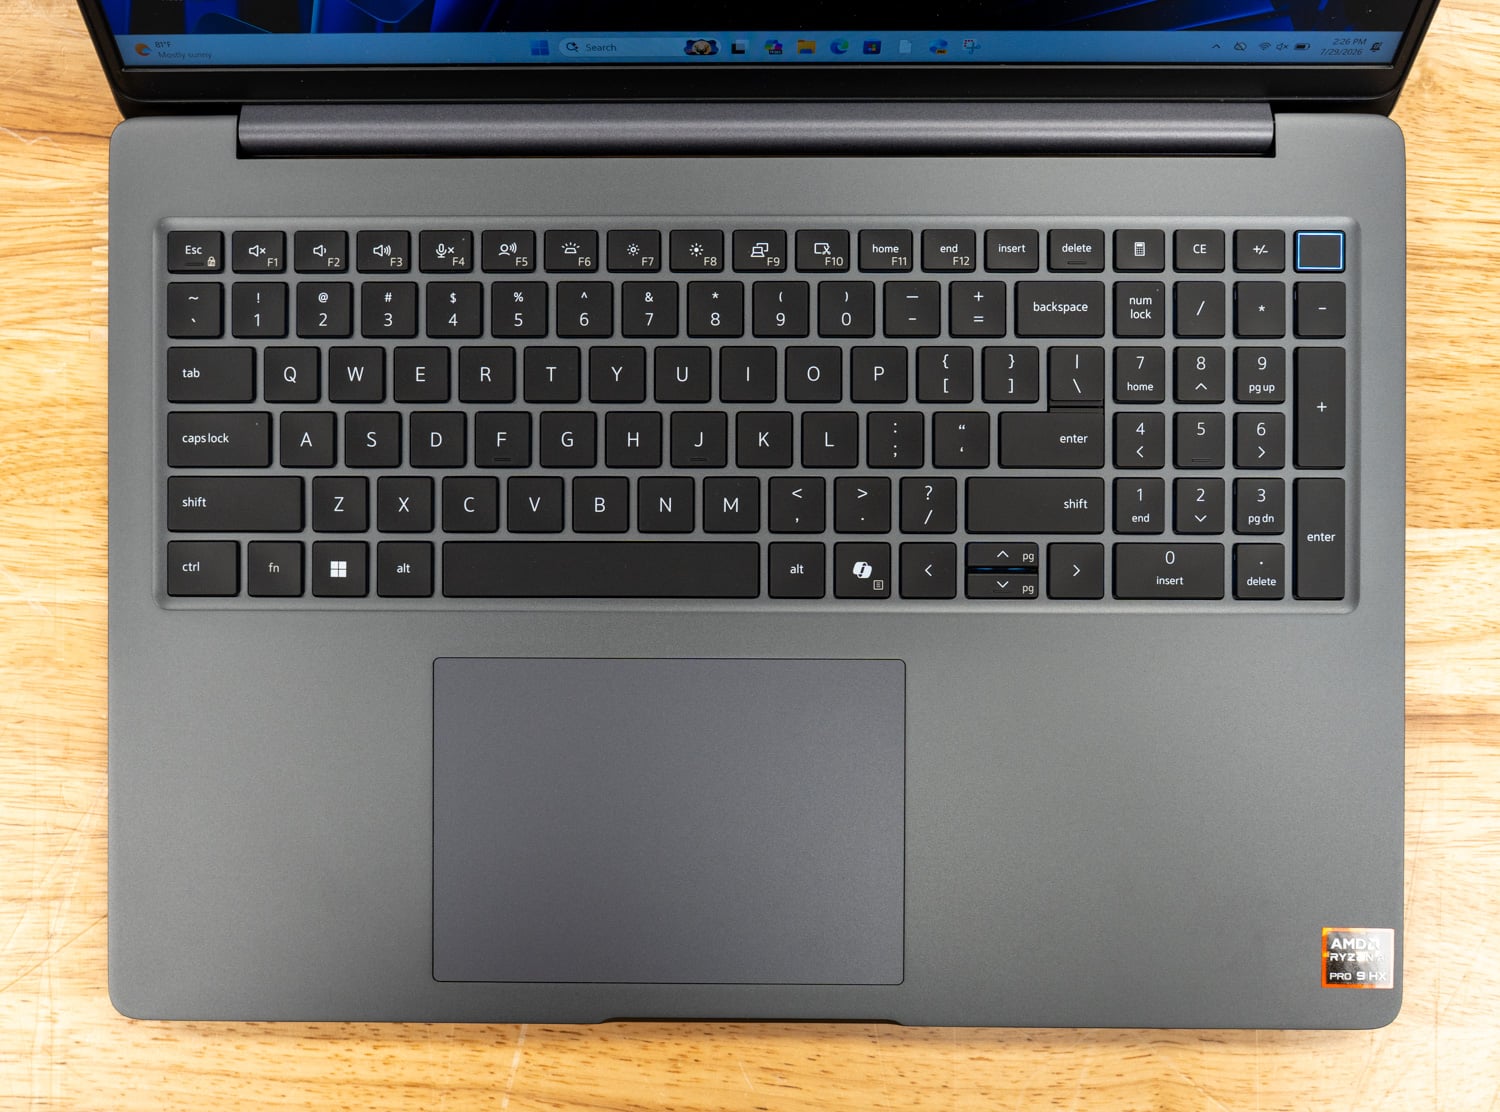
The wider keyboard deck gives Dell enough room for a full numeric keypad, which is one of the more noticeable design differences from the 14s AMD. The smaller 14s also uses a Mini-LED backlit keyboard, but its narrower chassis leaves out the dedicated number pad and uses that space for a more compact layout. For anyone spending a lot of time in spreadsheets, financial applications, or engineering software, the 16s’ separate numeric keypad is a welcome addition. Our unit also includes a dedicated Copilot key, while the power button and fingerprint reader are positioned in the upper-right corner above the number pad.
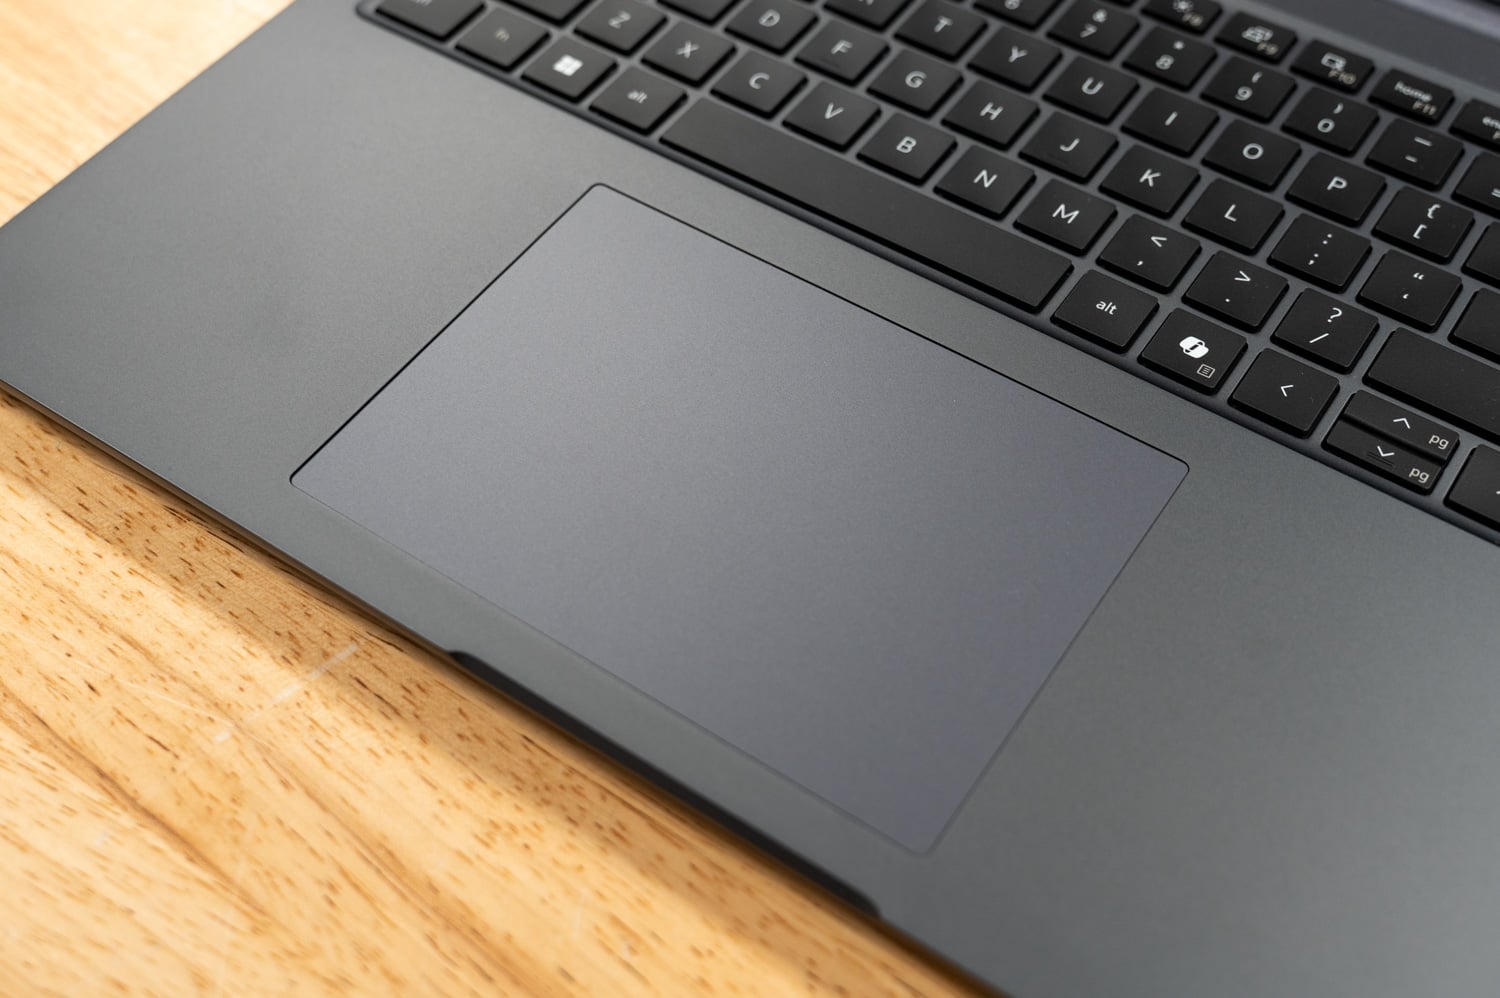
The large touchpad sits beneath the main typing area, keeping it better aligned with the user’s hands while typing. At 130 x 90 mm, it offers plenty of surface area for navigation and gestures, while the wider 16-inch chassis still leaves generous palm-rest space around it despite the full numeric keypad.
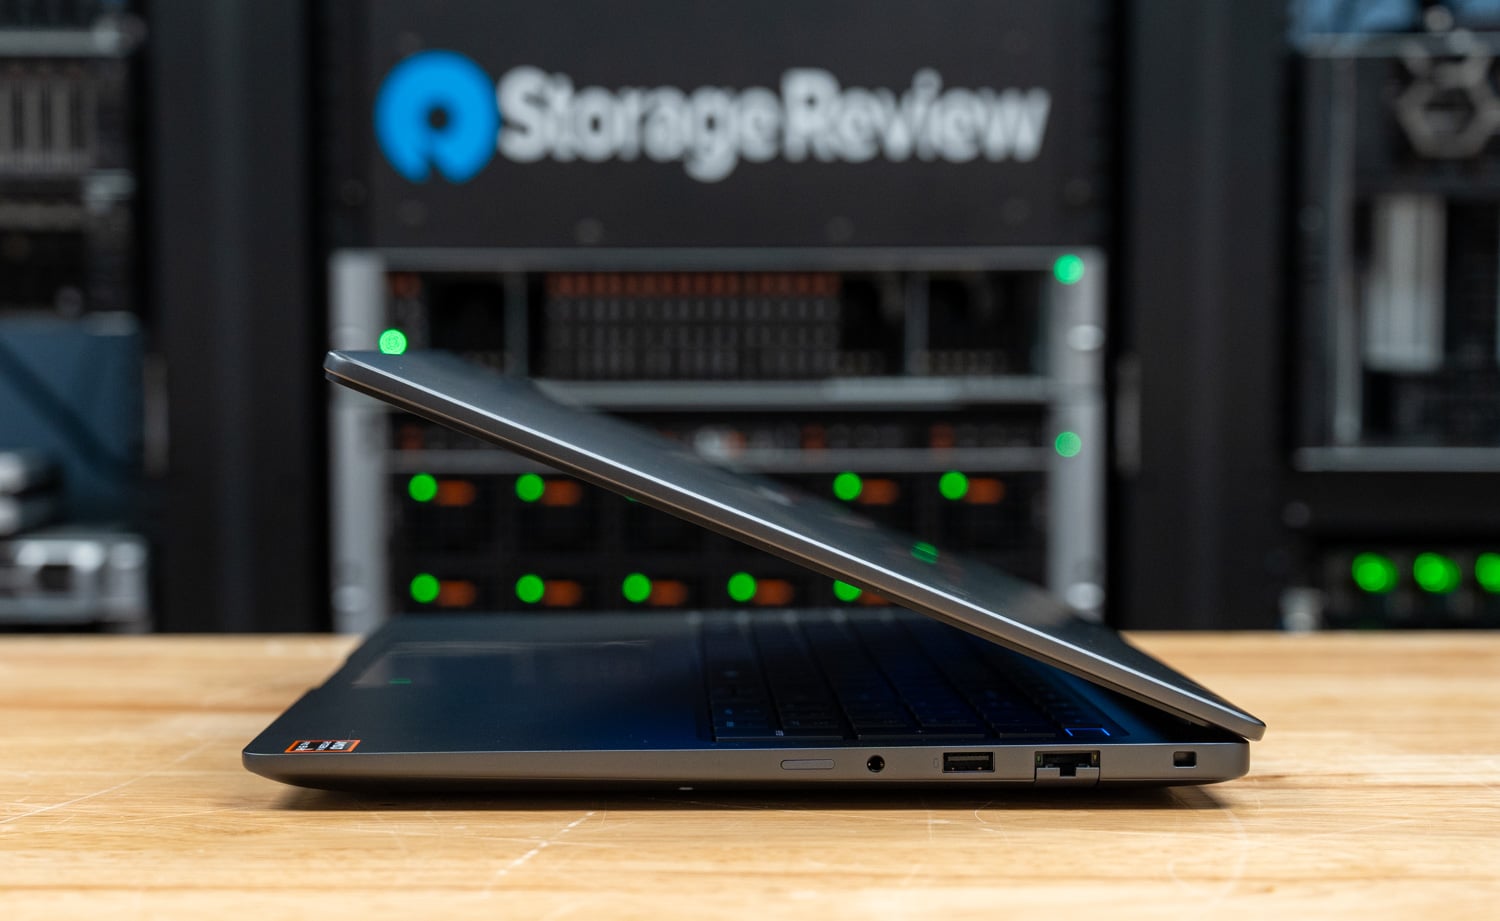
The right side keeps several legacy connections available, including a 3.5mm headset jack, a USB-A port with PowerShare, a 1 GbE RJ45 Ethernet port, and a wedge-shaped lock slot. Having Ethernet and USB-A built directly into the notebook is particularly useful in offices, labs, and managed environments where wired networking and older peripherals are still often used.
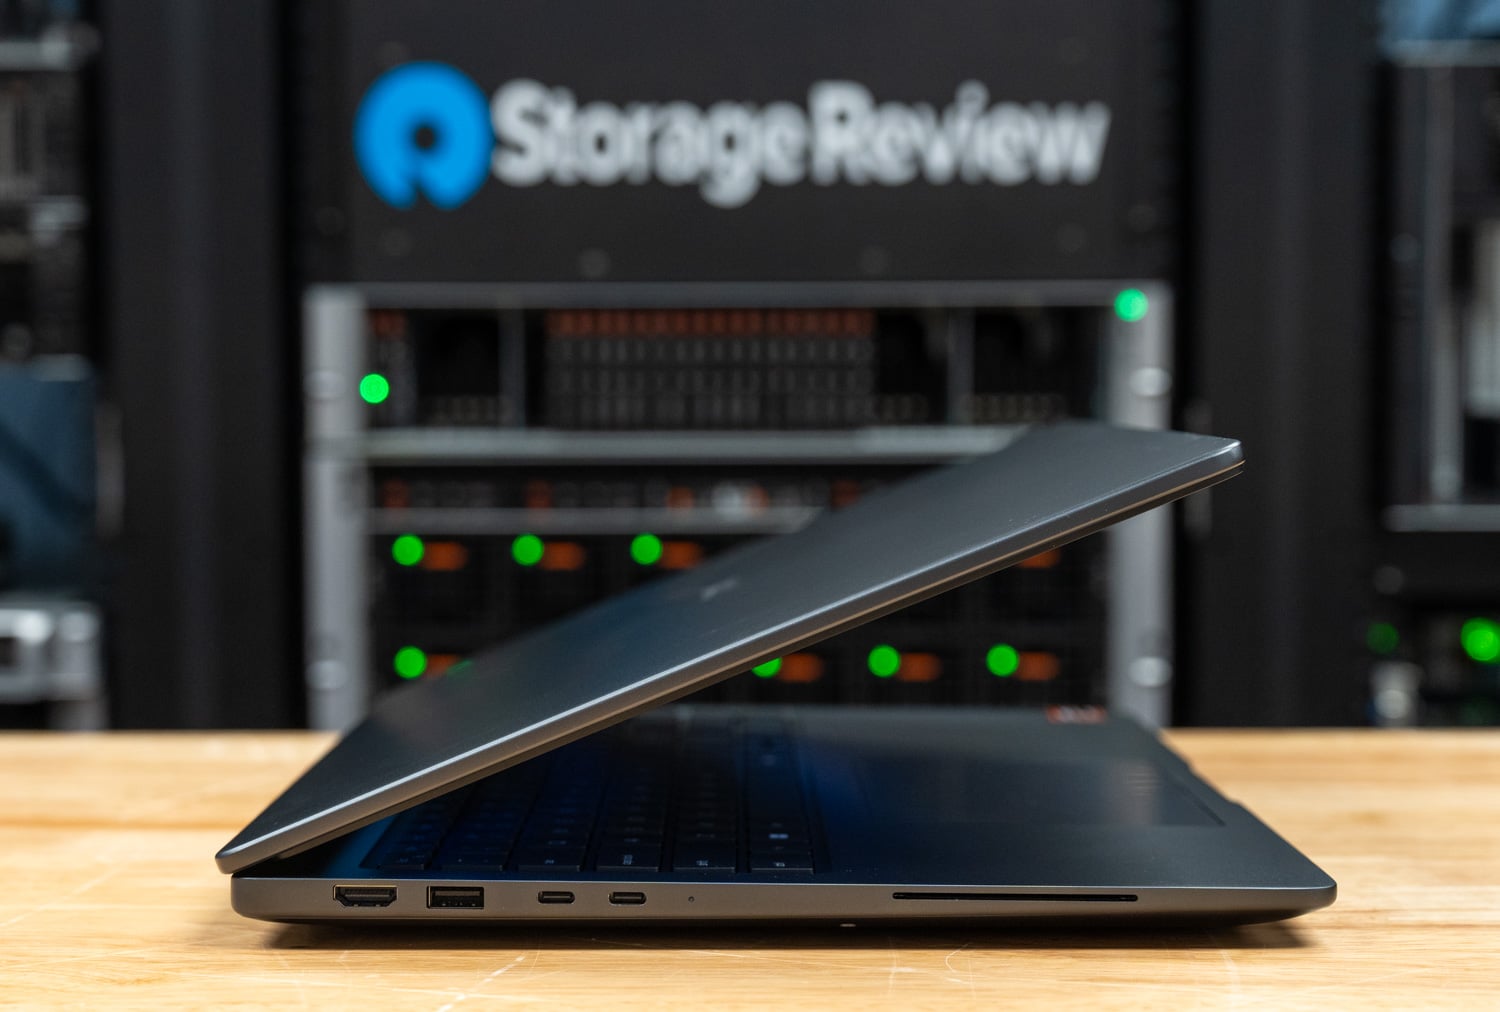
Most external display and docking connections are grouped on the left, including HDMI 2.1, another USB-A port, two Thunderbolt 4 USB-C ports, a battery-status light, and, in our configuration, the smart-card slot. The Thunderbolt 4 ports support DisplayPort and Power Delivery, which gives them enough flexibility for docking stations, external displays, fast storage, or charging.
The wide rear hinge spans much of the chassis and leaves the exhaust area open beneath the display, giving hot air a direct path away from the keyboard deck. Inside, the AMD 16s uses a single large fan and heatpipe assembly similar in layout to the Intel version, but the larger chassis gives the cooling system more room than Dell has available in the 14s. In the performance section below, several longer CPU tests show that the HX PRO 475 benefits from that extra space, even though the processor is unchanged.
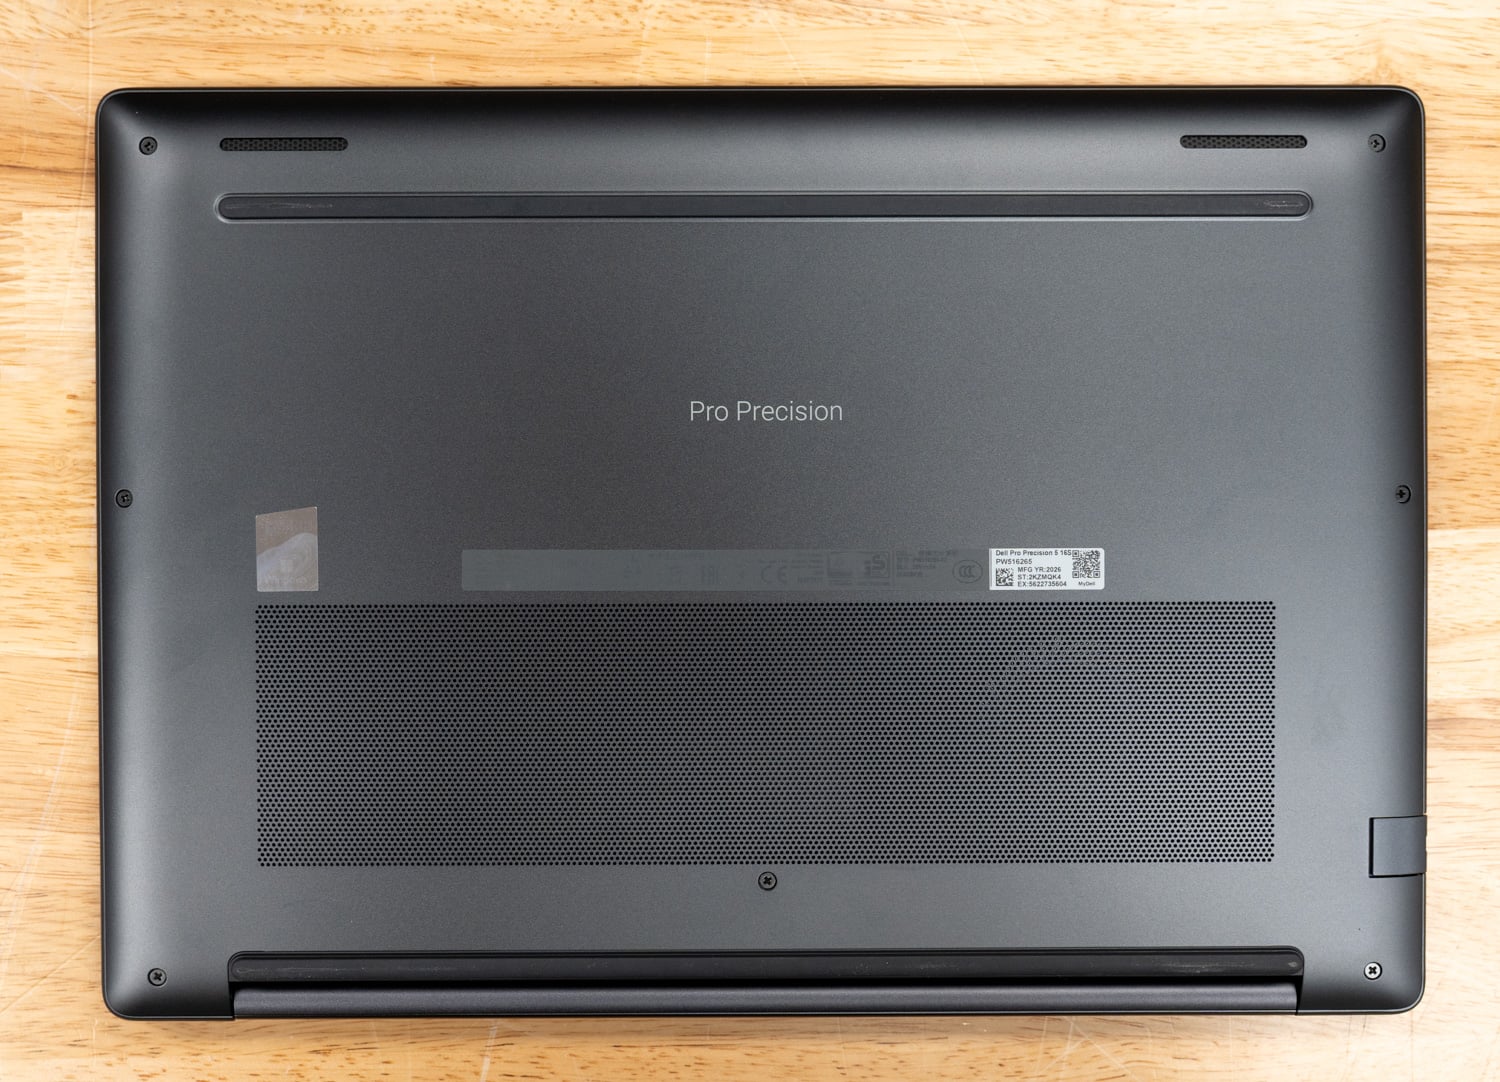
The underside features a wide perforated intake grille positioned beneath the fan and motherboard. Long rubber feet create clearance between the chassis and the desk. Dell secures the bottom cover with seven captive screws, keeping them attached to the panel during removal. Once loosened, you can release the cover from pry points along the upper edge and work it free around the perimeter.
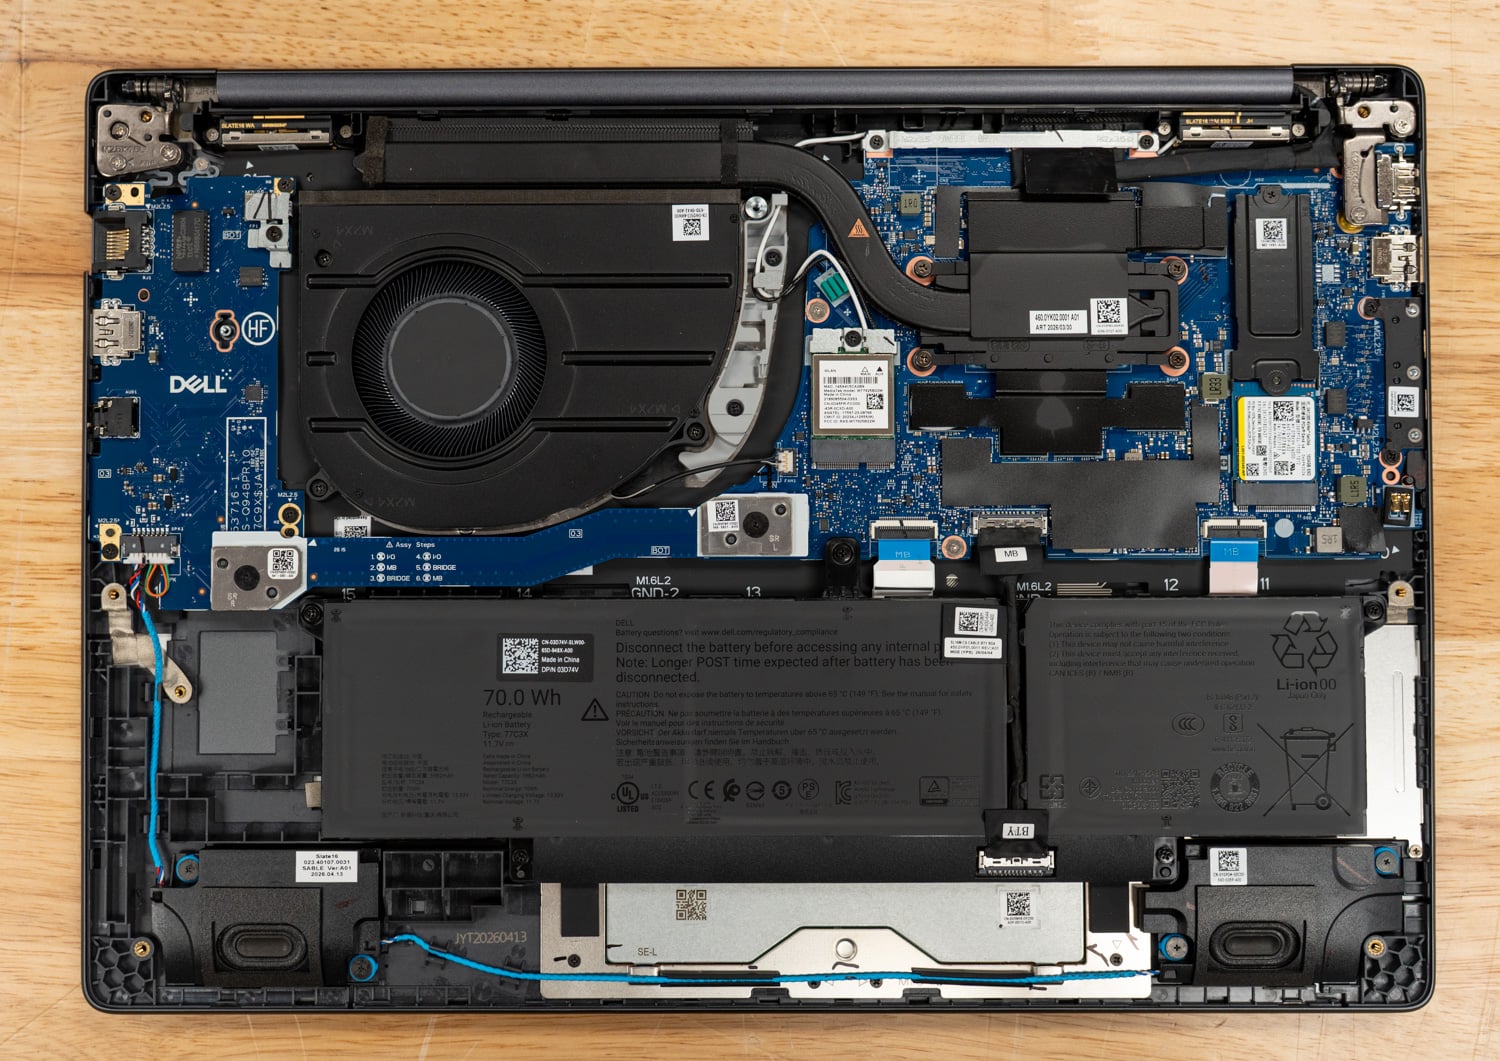
Removing the bottom cover gives you easy access to most of the parts you would realistically want to service, including the 70Wh battery, M.2 SSD, WLAN card, cooling fan, and speakers. The battery occupies most of the lower half of the chassis, while the SSD sits to the right and the wireless card sits closer to the center. One notable difference from the Intel 16s is the memory, since the AMD model does not use a replaceable LPCAMM2 module. That means you’ll need to choose the 64 GB capacity at the time of purchase.
Dell Pro Precision 5 16s AMD Performance
Our review unit runs the Ryzen AI 9 HX PRO 475 with Radeon 890M integrated graphics, 64GB of LPDDR5x, and a 1TB SSD on Windows 11 Pro, with benchmarks tested in the Best Performance power mode. For battery life testing, we configure systems into Balanced power mode and set the screen brightness to 50%.
For comparables, we included the other three systems in this family: the Dell Pro Precision 5 16s Intel, the Dell Pro Precision 5 14s AMD, and the Dell Pro Precision 5 14s Intel, giving a clean read on both the Intel-versus-AMD question and the 14-versus-16 question at matched configurations.
A note on GPU labeling: the AMD systems in this group run Radeon 890M integrated graphics, while the Intel systems run Arc Pro B390; charts call out the GPU where a result is graphics-bound.
PCMark 10
PCMark 10 measures general system performance across everyday work such as web browsing, video conferencing, spreadsheets, writing, photo editing, and rendering. The overall score includes Essentials, Productivity, and Digital Content Creation subscores that provide additional context for performance across those workload groups. Higher scores are better.
| PCMark 10 | Dell Pro Precision 5 16s AMD | Dell Pro Precision 5 16s Intel | Dell Pro Precision 5 14s AMD | Dell Pro Precision 5 14s Intel |
|---|---|---|---|---|
| Overall Score | 8,627 | 9,994 | 8,762 | 10,019 |
| Essentials | 10,744 | 12,106 | 11,442 | 12,188 |
| Productivity | 14,574 | 15,505 | 14,272 | 15,827 |
| Digital Content Creation | 11,127 | 14,433 | 11,178 | 14,147 |
The Pro Precision 5 16s AMD finished PCMark 10 at 8,627 overall, putting it very close to the 14s AMD but about 16% behind the 16s Intel. Productivity was its best relative showing at 14,574, slightly ahead of the 14s AMD’s 14,272, while Digital Content Creation came in at 11,127 and was essentially unchanged from the smaller AMD model. General productivity performance therefore changes very little with the larger AMD chassis, while the Intel configurations keep a sizeable advantage in this test.
PCMark 10 Modern Office Battery
The PCMark 10 Modern Office battery test repeatedly runs common office tasks until the battery reaches the test’s cutoff point, in Balanced mode at 50 percent display brightness. This is a rundown of the whole system rather than a synthetic idle drain, so it tracks closely with what a full day of productivity work does to the battery. Longer runtimes are better.
| Modern Office Battery | Dell Pro Precision 5 16s AMD | Dell Pro Precision 5 16s Intel | Dell Pro Precision 5 14s AMD | Dell Pro Precision 5 14s Intel |
|---|---|---|---|---|
| Runtime (higher is better) | 15 hours 5 minutes | 24 hours 43 minutes | 14 hours 26 minutes | 23 hours 50 minutes |
Battery life reached 15 hours and 5 minutes, giving the 16s AMD another 39 minutes over the 14s AMD despite its larger QHD+ display. That is a good result for a 16-inch workstation, but the platform gap is substantial: the 16s Intel lasts 24 hours and 43 minutes on the same 70Wh capacity. Those who spend long periods away from an outlet will get a major advantage from the Intel version, while the AMD 16s still gets through a long working day.
Geekbench 6
Geekbench 6 measures processor performance using a mix of common tasks, with separate scores for single-core and multi-core workloads, plus GPU compute scores through OpenCL and Vulkan. Higher scores are better.
| Geekbench 6 | Dell Pro Precision 5 16s AMD (Radeon 890M) | Dell Pro Precision 5 16s Intel (Arc Pro B390) | Dell Pro Precision 5 14s AMD (Radeon 890M) | Dell Pro Precision 5 14s Intel (Arc Pro B390) |
|---|---|---|---|---|
| CPU Single-Core | 2,854 | 2,969 | 2,831 | 3,010 |
| CPU Multi-Core | 14,169 | 17,401 | 14,611 | 17,396 |
| GPU OpenCL | 37,520 | 57,998 | 36,322 | 56,745 |
| GPU Vulkan | 53,969 | 63,015 | 49,868 | 55,581 |
Geekbench 6 shows the 16s AMD performing close to its 14-inch counterpart, with a small gain in single-core performance and somewhat better GPU compute results, but multicore dropped to 14,169 from 14,611. The Intel 16s was 23% faster in multicore and 55% faster in OpenCL, while the AMD model narrowed the gap in Vulkan to 53,969 compared with 63,015. In this test, the larger chassis did little to improve overall performance compared with the 14s AMD.
Geekbench 7
Geekbench 7 joins the suite alongside Geekbench 6 as comparison data builds. Its CPU scores are calibrated against a baseline of 2,500, set by the AMD Ryzen 7700, while GPU scores are calibrated against a baseline of 100,000, set by the NVIDIA GeForce RTX 4060. Higher scores are better, and double the score indicates double the performance. Because Geekbench 7 uses new workloads and new baselines, its scores are not comparable to Geekbench 6 results.
| Geekbench 7 | Dell Pro Precision 5 16s AMD (Radeon 890M) | Dell Pro Precision 5 16s Intel (Arc Pro B390) | Dell Pro Precision 5 14s AMD (Radeon 890M) | Dell Pro Precision 5 14s Intel (Arc Pro B390) |
|---|---|---|---|---|
| CPU Single-Core | 2,659 | 2,733 | 2,571 | 2,702 |
| CPU Multi-Core | 16,641 | 18,965 | 15,514 | 18,788 |
| GPU OpenCL | 31,874 | 54,247 | 31,423 | 54,854 |
| GPU Vulkan | * | 47,436 | * | 46,906 |
*Both Precision AMD units failed workload validation in the Geekbench 7 Vulkan run, which assigns a score of zero to the affected subtest. We traced it to the fluid simulation workload and have discarded both results pending clean runs.
Geekbench 7 gives the larger AMD model a better showing, with its 16,641 multicore score improving by 7% over the 14s AMD and single-core rising to 2,659. Intel still leads at 18,965 multicore, while the Arc Pro B390 widens the GPU gap considerably with 54,247 in OpenCL compared with 31,874 from the Radeon 890M. The AMD systems did not return a valid Vulkan result in this test, so that comparison is limited to OpenCL.
Cinebench 2026
Cinebench 2026 is the current release in the Cinebench line and the only version we report. It tests CPU and GPU performance using Maxon’s Redshift render engine. It is built on the latest Cinema 4D 2026 code and is designed to show whether a machine is stable under high CPU load, whether a notebook’s cooling can sustain longer render tasks, and how it handles demanding real-world 3D work. Because code and compiler changes accelerated scene rendering, Cinebench 2026 scores use an adjusted range and should not be compared to scores from previous Cinebench versions. Its GPU test supports current AMD and NVIDIA hardware but does not yet run on Intel integrated graphics.
| Cinebench 2026 | Dell Pro Precision 5 16s AMD | Dell Pro Precision 5 16s Intel | Dell Pro Precision 5 14s AMD | Dell Pro Precision 5 14s Intel |
|---|---|---|---|---|
| CPU Single Thread | 471 | 535 | 466 | 513 |
| CPU Multiple Threads | 4,767 | 4,618 | 4,230 | 4,513 |
| GPU | 5,667 | N/A | 5,313 | N/A |
Cinebench 2026 is one of the better examples of what the larger AMD chassis can do with the 24-thread Ryzen AI 9 HX PRO 475. Its multicore score of 4,767 leads the entire group, beating the 16s Intel by 3% and the 14s AMD by nearly 13%, while its Radeon 890M GPU score also improves by about 7% over the smaller AMD model. Intel retains the single-thread lead at 535 versus 471, so AMD’s advantage here is tied specifically to heavier workloads.
7-Zip Compression
The built-in 7-Zip benchmark measures how quickly the processor can compress and decompress data using multiple threads, run with a 128MB dictionary across ten passes. Decompression tends to scale with thread count, while compression leans on memory latency, so the two halves often tell different stories. Higher GIPS scores are better.
| 7-Zip 24.09 (GIPS) | Dell Pro Precision 5 16s AMD | Dell Pro Precision 5 16s Intel | Dell Pro Precision 5 14s AMD | Dell Pro Precision 5 14s Intel |
|---|---|---|---|---|
| Compressing | 85.627 | 96.281 | 89.099 | 92.836 |
| Decompressing | 117.863 | 97.246 | 117.545 | 93.089 |
| Total Rating | 101.745 | 96.764 | 103.322 | 92.963 |
The Ryzen AI 9 HX PRO 475 shows its thread-count advantage most strongly during decompression, where the 16s AMD reaches 117.863 GIPS and finishes more than 20% ahead of the Intel 16s. Compression is weaker at 85.627 GIPS, pulling the total rating down to 101.745 and leaving the 14s AMD narrowly ahead overall at 103.322. Even so, the AMD 16s finishes about 5% ahead of its Intel counterpart in the combined score.
y-cruncher
y-cruncher measures how quickly the processor can calculate large numbers of digits of Pi, placing a heavy load on the CPU and memory subsystem. At the same time, the BBP runs to extract hexadecimal digits of Pi. Results are in seconds, so lower times are better. Neither Pro Precision AMD unit could complete the 5-billion- or 10-billion-digit runs because the memory these platforms reserve for the integrated GPU leaves less available than those problem sizes require; the previous-generation Pro 5 16 AMD completed 5 billion but not 10 billion.
| y-cruncher (seconds, lower is better) | Dell Pro Precision 5 16s AMD | Dell Pro Precision 5 16s Intel | Dell Pro Precision 5 14s AMD | Dell Pro Precision 5 14s Intel |
|---|---|---|---|---|
| Pi 1B | 22.840 | 26.422 | 24.648 | 28.404 |
| Pi 2.5B | 64.242 | 80.463 | 71.084 | 83.968 |
| Pi 5B | N/A | 183.822 | N/A | 190.356 |
| Pi 10B | N/A | 407.658 | N/A | 417.224 |
| Pi BBP 1B | 1.100 | 1.635 | 1.104 | 1.684 |
| Pi BBP 10B | 12.277 | 19.036 | 14.333 | 20.028 |
| Pi BBP 100B | 140.284 | 234.797 | 166.762 | 241.409 |
The Pro Precision 5 16s AMD was the fastest system across all y-cruncher workloads it could complete, including 22.840 seconds at Pi 1B and 64.242 seconds at Pi 2.5B. The larger chassis also improves quite a bit compared to the 14s AMD, cutting the Pi 2.5B time by roughly 10% and the BBP 100B time from 166.762 to 140.284 seconds. The missing 5B and 10B results are caused by the memory reserved for the Radeon 890M, which leaves too little system memory available for those problem sizes (rather than the processor failing the workload itself).
Blender
The Blender benchmark measures rendering performance using three different 3D scenes: Monster, Junkshop, and Classroom. Results are reported in samples per minute, so higher scores are better. We test on both the CPU and GPU. Scores are not comparable across Blender versions, so we report the scores for the current 5.2 release here.
| Blender 5.2 (samples/min) | Dell Pro Precision 5 16s AMD (Radeon 890M) | Dell Pro Precision 5 16s Intel (Arc Pro B390) | Dell Pro Precision 5 14s AMD (Radeon 890M) | Dell Pro Precision 5 14s Intel (Arc Pro B390) |
|---|---|---|---|---|
| GPU | ||||
| Monster | 123.00 | 572.84 | 124.50 | 567.52 |
| Junkshop | 101.21 | 468.85 | 101.06 | 463.30 |
| Classroom | 82.84 | 420.48 | 82.95 | 417.38 |
| CPU | ||||
| Monster | 130.86 | 138.88 | 127.02 | 133.46 |
| Junkshop | 99.74 | 94.97 | 95.84 | 94.27 |
| Classroom | 74.18 | 65.39 | 71.63 | 64.26 |
Blender separates the CPU and GPU sides of the AMD configuration very quickly, with the Radeon 890M producing results almost identical to the 14s AMD, while the Arc Pro B390 was, as expected, several times faster. CPU rendering favors the 16s AMD, which leads Junkshop at 99.74 samples per minute and Classroom at 74.18, while also improving over the 14s AMD in all three scenes.
LuxMark
LuxMark measures GPU compute performance by rendering complex scenes through OpenCL, based on LuxCoreRender. We run the Food and Hall scenes on all available OpenCL devices in each system, so the GPU listed in each column header did the rendering. Higher scores are better.
| LuxMark v4 | Dell Pro Precision 5 16s AMD (Radeon 890M) | Dell Pro Precision 5 16s Intel (Arc Pro B390) | Dell Pro Precision 5 14s AMD (Radeon 890M) | Dell Pro Precision 5 14s Intel (Arc Pro B390) |
|---|---|---|---|---|
| Hall | 2,058 | 3,505 | 2,077 | 3,494 |
| Food | 1,034 | 1,713 | 1,041 | 1,705 |
LuxMark shows almost no real difference between the two AMD chassis sizes, with the 16s scoring 2,058 in Hall and 1,034 in Food compared with 2,077 and 1,041 from the 14s. Intel’s Arc Pro B390 is much stronger in this OpenCL workload, reaching 3,505 in Hall and 1,713 in Food. The nearly identical AMD results also show that the larger chassis offers little benefit to Radeon 890M performance in this OpenCL workload.
V-Ray
Chaos V-Ray measures ray-traced rendering throughput, reported in vpaths, where higher is better. We run the CUDA-compatible engine on every system so results remain comparable to notebooks with discrete graphics; on systems without a discrete GPU, that path executes on the integrated graphics, even though V-Ray reports the processor name in its device field.
| V-Ray GPU (vpaths) | Dell Pro Precision 5 16s AMD (Radeon 890M) | Dell Pro Precision 5 16s Intel (Arc Pro B390) | Dell Pro Precision 5 14s AMD (Radeon 890M) | Dell Pro Precision 5 14s Intel (Arc Pro B390) |
|---|---|---|---|---|
| CUDA Engine | 1,039 | 946 | 897 | 890 |
The Radeon 890M in the 16s AMD produced the highest V-Ray result in the group at 1,039 vpaths, putting it about 10% ahead of the 16s Intel and 16% ahead of the 14s AMD. This was one of the few GPU-focused tests in which the AMD configuration finished ahead of the Arc Pro B390, despite Intel holding much larger advantages in several other graphics benchmarks.
3DMark CPU Profile
The 3DMark CPU Profile benchmark measures CPU performance at fixed thread counts, from a single thread up to the maximum available, showing how performance scales as more cores are engaged. Higher scores are better.
| 3DMark CPU Profile | Dell Pro Precision 5 16s AMD | Dell Pro Precision 5 16s Intel | Dell Pro Precision 5 14s AMD | Dell Pro Precision 5 14s Intel |
|---|---|---|---|---|
| Max Threads | 9,267 | 10,748 | 8,778 | 10,277 |
| 8 Threads | 6,573 | 6,818 | 6,270 | 6,441 |
| 4 Threads | 4,238 | 4,483 | 4,047 | 4,176 |
| 1 Thread | 1,178 | 1,210 | 1,160 | 1,174 |
The larger chassis gives the 16s AMD a modest improvement over the 14s AMD across all thread counts, including a 9,267 max-thread score that is about 6% higher than the smaller model. Intel still leads the table at 10,748 with all threads active and also stays ahead at eight, four, and one thread. So, while the AMD 16s does benefit from the additional thermal room, it isn’t enough to overtake the X9 388H in this particular CPU test.
3DMark Storage and Blackmagic Disk Speed Test
3DMark Storage measures how an SSD performs during gaming-related tasks such as loading games, installing software, saving progress, and moving game files. Blackmagic Disk Speed Test measures an SSD’s sequential read and write speeds using large media files. Higher is better in both.
| Storage | Dell Pro Precision 5 16s AMD | Dell Pro Precision 5 16s Intel | Dell Pro Precision 5 14s AMD | Dell Pro Precision 5 14s Intel |
|---|---|---|---|---|
| 3DMark Storage | 2,325 | 2,804 | 2,424 | 3,093 |
| Blackmagic Write (MB/s) | 5,070.5 | 7,660.2 | 4,772.0 | 9,000.8 |
| Blackmagic Read (MB/s) | 5,071.2 | 8,418.1 | 4,900.4 | 9,809.2 |
Storage performance reflects the Gen4 SSD used in our AMD review unit, with Blackmagic reporting almost identical read and write speeds of roughly 5.07 GB/s. That is slightly faster sequentially than the SSD in the 14s AMD, although its 3DMark Storage score of 2,325 was a little lower. Both Intel systems use much faster storage configurations, with the 16s Intel reaching 8.4 GB/s reads and the 14s Intel approaching 9.8 GB/s.
Blackmagic RAW Speed Test
The Blackmagic RAW Speed Test measures how many frames per second a system can decode Blackmagic RAW video on the CPU and on the GPU. We quote the 8K results at 12:1 compression, and higher is better.
| Blackmagic RAW Speed Test | Dell Pro Precision 5 16s AMD (Radeon 890M) | Dell Pro Precision 5 16s Intel (Arc Pro B390) | Dell Pro Precision 5 14s AMD (Radeon 890M) | Dell Pro Precision 5 14s Intel (Arc Pro B390) |
|---|---|---|---|---|
| 8K 12:1 CPU (fps) | 74 | 77 | 77 | 79 |
| 8K 12:1 GPU (fps) | 49 | 87 | 49 | 85 |
Blackmagic RAW shows almost no chassis-size difference between the two AMD systems, with both Radeon 890M configurations reaching 49 fps in the GPU decode test. The 16s AMD recorded 74 fps on the CPU path, a few frames behind the other three systems, while the Arc Pro B390 in the Intel 16s reached 87 fps on the GPU. Video workflows that use GPU-accelerated BRAW decoding therefore favor Intel quite heavily within the Pro Precision 5 family.
Topaz Video AI
The Topaz Video AI benchmark measures AI video upscaling and frame-interpolation performance in frames per second across the application’s enhancement models, run here at 1080p input, where higher is better. The previous-generation Pro 5 16 AMD was not tested with Topaz.
| Topaz Video AI (fps) | Dell Pro Precision 5 16s AMD (Radeon 890M) | Dell Pro Precision 5 16s Intel (Arc Pro B390) | Dell Pro Precision 5 14s AMD (Radeon 890M) | Dell Pro Precision 5 14s Intel (Arc Pro B390) |
|---|---|---|---|---|
| Artemis 1X / 2X / 4X | 3.72 / 2.21 / 0.78 | 6.24 / 5.21 / 1.90 | 3.75 / 2.24 / 0.79 | 6.22 / 5.28 / 1.89 |
| Iris 1X / 2X / 4X | 4.91 / 2.72 / 0.92 | 5.29 / 3.19 / 0.96 | 4.86 / 2.70 / 0.86 | 5.18 / 3.14 / 0.94 |
| Proteus 1X / 2X / 4X | 3.99 / 2.70 / 1.18 | 6.45 / 6.09 / 2.47 | 3.93 / 2.69 / 1.19 | 6.43 / 6.08 / 2.46 |
| Gaia 1X / 2X / 4X | 1.87 / 1.34 / 0.96 | 3.30 / 2.26 / 1.51 | 1.90 / 1.35 / 0.94 | 3.24 / 2.25 / 1.50 |
| Nyx 1X / 2X | 1.87 / 1.53 | 1.56 / 1.57 | 1.86 / 1.56 | 1.57 / 1.54 |
| Hyperion HDR 1X | 11.48 | 3.23 | 11.34 | 3.22 |
| 4X Slowmo Apollo / APFast | 6.08 / 17.59 | 8.48 / 22.00 | 6.05 / 17.72 | 8.57 / 22.13 |
| 16X Slowmo Aion | 9.05 | DNF | 9.13 | DNF |
Topaz Video AI gives the Radeon 890M a much more mixed result than the broader graphics benchmarks, with Intel leading Artemis, Iris, Proteus, Gaia, and both Apollo tests, while the AMD systems perform far better in Hyperion HDR. The 16s AMD reached 11.48 fps in Hyperion compared with only 3.23 fps from the Intel 16s, and it also completed the 16X Aion workload at 9.05 fps while both Intel systems failed to finish it. Across most other rows, its results are nearly identical to the smaller 14s AMD.
UL Procyon AI Text Generation
The Procyon AI Text Generation Benchmark measures local LLM performance across four models: Phi, Mistral, Llama3, and Llama2. All four systems ran the models through ONNX Runtime with DirectML on their respective GPUs, providing a common test path for comparing inference performance across Intel and AMD graphics hardware. Higher scores are better.
| Procyon AI Text Generation | Dell Pro Precision 5 16s AMD (Radeon 890M) | Dell Pro Precision 5 16s Intel (Arc Pro B390) | Dell Pro Precision 5 14s AMD (Radeon 890M) | Dell Pro Precision 5 14s Intel (Arc Pro B390) |
|---|---|---|---|---|
| Phi | 434 | 893 | 424 | 887 |
| Mistral | 403 | 646 | 396 | 646 |
| Llama3 | 357 | 669 | 352 | 674 |
| Llama2 | 390 | 750 | 379 | 786 |
Local LLM performance heavily favors Intel’s Arc Pro B390, although the 16s AMD does improve slightly over the 14s AMD across all four models. The Radeon 890M scores 434 on Phi, 403 on Mistral, 357 on Llama3, and 390 on Llama2, while the Intel 16s ranges from roughly 60% to more than twice as fast, depending on the model. For users who plan to run GPU-based local language models regularly, the Intel configuration offers a significant advantage.
UL Procyon AI Computer Vision
The Procyon AI Computer Vision Benchmark measures AI inference performance across CPUs, GPUs, and dedicated accelerators using a range of neural networks, evaluating tasks such as image classification, object detection, segmentation, and super-resolution with models including MobileNet V3, Inception V4, YOLO V3, DeepLab V3, Real ESRGAN, and ResNet 50. The WinML runs use float32 on CPU and GPU, giving a like-for-like view across vendors. We also run the newer Computer Vision 2 suite through each vendor’s native path, Ryzen AI in int8 on the AMD NPUs and OpenVINO on the Intel NPU and iGPU; those results are listed separately since precision and runtime differ by platform. Higher scores are better.
| Procyon AI Computer Vision (WinML) | Dell Pro Precision 5 16s AMD | Dell Pro Precision 5 16s Intel | Dell Pro Precision 5 14s AMD | Dell Pro Precision 5 14s Intel |
|---|---|---|---|---|
| CPU | 114 | 143 | 106 | 141 |
| GPU | 245 | 410 | 247 | 404 |
| Procyon AI Computer Vision 2 (native runtimes) | Dell Pro Precision 5 16s AMD | Dell Pro Precision 5 16s Intel | Dell Pro Precision 5 14s AMD | Dell Pro Precision 5 14s Intel |
|---|---|---|---|---|
| NPU | 1,189 | 1,630 | 1,176 | 1,647 |
| iGPU | N/A | 1,529 | N/A | 1,517 |
Procyon Computer Vision again favors Intel on the common WinML path, with the 16s AMD scoring 114 on CPU and 245 on GPU, compared with 143 and 410 from the Intel model. The AMD configuration does improve its CPU score over the 14s AMD, while GPU performance is effectively identical between the two Radeon systems. Through the newer native-runtime test, the 60 TOPS Ryzen AI NPU reaches 1,189, almost unchanged from the 14s AMD’s 1,176 but below the Intel 16s result of 1,630.
UL Procyon AI Image Generation
The Procyon AI Image Generation Benchmark measures local image-generation performance across Stable Diffusion XL FP16, Stable Diffusion 1.5 FP16, and Stable Diffusion 1.5 INT8 workloads. The AMD systems use the optimized DirectML path for Radeon graphics, while the Intel systems use OpenVINO. The INT8 NPU test requires a supported quantized model, which was not available for the current AMD configurations.
| Procyon AI Image Generation | Dell Pro Precision 5 16s AMD (Radeon 890M) | Dell Pro Precision 5 16s Intel (Arc Pro B390) | Dell Pro Precision 5 14s AMD (Radeon 890M) | Dell Pro Precision 5 14s Intel (Arc Pro B390) |
|---|---|---|---|---|
| SD 1.5 FP16 | 316 | 638 | 281 | 632 |
| SDXL FP16 | 200 | 738 | 197 | 731 |
| SD 1.5 INT8 (iGPU) | 2,855 | 7,778 | N/A | 7,873 |
| SD 1.5 INT8 (NPU) | N/A | 2,881 | N/A | 3,003 |
Image generation shows the same architectural split, with the AMD 16s improving over its 14-inch counterpart but still trailing the Arc Pro B390 by a wide margin. The Radeon 890M scores 316 in Stable Diffusion 1.5 FP16 and 200 in SDXL, compared with 638 and 738 from the Intel 16s, while the INT8 iGPU workload widens the difference to 2,855 versus 7,778.
SPECviewperf 15
SPECviewperf 15 measures graphics performance using viewsets derived from professional applications in CAD, 3D modeling, rendering, engineering, and medical visualization, replayed here at 1080p. Higher scores are better, although performance can vary considerably between applications and graphics architectures. The enscape-01 viewset failed to complete on the review unit across multiple runs, and catia-07 failed on the Intel twin.
| SPECviewperf 15 (FHD) | Dell Pro Precision 5 16s AMD (Radeon 890M) | Dell Pro Precision 5 16s Intel (Arc Pro B390) | Dell Pro Precision 5 14s AMD (Radeon 890M) | Dell Pro Precision 5 14s Intel (Arc Pro B390) |
|---|---|---|---|---|
| 3dsmax-08 | 26.23 | 21.46 | 26.30 | 19.51 |
| blender-01 | 23.17 | 23.15 | 23.01 | 21.55 |
| catia-07 | 22.70 | 26.35 | 22.70 | DNF |
| creo-04 | 49.42 | 68.14 | 49.27 | 63.57 |
| energy-04 | 29.69 | 38.86 | 29.51 | 38.07 |
| enscape-01 | 8.45 | 15.24 | DNF | 14.92 |
| maya-07 | 53.48 | 85.61 | 53.30 | 83.86 |
| medical-04 | 73.31 | 70.91 | 73.42 | 69.41 |
| snx-05 | 61.33 | 80.24 | 59.58 | 78.74 |
| solidworks-08 | 36.40 | 32.99 | 36.66 | 33.38 |
| unreal_engine-01 | 27.38 | 42.15 | 27.31 | 41.38 |
Professional graphics performance is more workload-dependent than the general GPU tests, with the 16s AMD beating the Intel model in 3dsmax, narrowly matching it in blender, and leading in medical and solidworks. Intel has much larger advantages in creo, energy, enscape, maya, solidworks, and unreal engine, however, including 85.61 versus 53.48 in Maya. The 16s AMD also completed enscape at 8.45, where the 14s AMD failed, whereas most of its other results track very closely with the smaller Radeon system.
SPECworkstation 4
SPECworkstation 4 measures workstation performance across CPU, graphics, storage, AI, product design, engineering, financial services, and other professional workloads, using real applications grouped into seven industry verticals. Higher scores are better, and N/A means the system did not complete every workload required for that category.
| SPECworkstation 4 | Dell Pro Precision 5 16s AMD | Dell Pro Precision 5 16s Intel | Dell Pro Precision 5 14s AMD | Dell Pro Precision 5 14s Intel |
|---|---|---|---|---|
| Hardware Subsystems | ||||
| CPU | N/A | 1.34 | 1.15 | N/A |
| Graphics | 2.65 | 2.67 | 2.57 | 2.70 |
| Accelerator | 2.31 | 2.25 | 2.22 | 2.29 |
| Storage | 1.00 | 1.80 | 0.93 | 1.70 |
| Industry Verticals | ||||
| AI & Machine Learning | 1.45 | 1.47 | 1.38 | 1.45 |
| Energy | 1.38 | 1.55 | 1.28 | 1.67 |
| Financial Services | 1.29 | 0.94 | 1.07 | 0.93 |
| Life Sciences | 1.47 | 1.84 | 1.41 | N/A |
| Media & Entertainment | 1.48 | 1.60 | 1.39 | 1.53 |
| Product Design | 1.41 | 1.75 | 1.34 | 1.80 |
| Productivity & Development | N/A | 1.35 | 1.03 | 1.32 |
SPECworkstation gives the 16s AMD a few useful wins, including the highest Accelerator score at 2.31 and the strongest Financial Services result at 1.29. Graphics is effectively tied with the Intel 16s at 2.65 versus 2.67, while Intel has much stronger results in Storage, Energy, Life Sciences, Media and Entertainment, and Product Design. The AMD 16s improves on the 14s AMD in nearly every completed category, although its CPU and Productivity and Development scores are N/A because one or more required workloads did not complete.
Conclusion
The Dell Pro Precision 5 16s AMD was strongest in heavily threaded CPU workloads, often outperforming the 14s AMD despite using the same Ryzen AI 9 HX PRO 475. Cinebench 2026 multicore reached 4,767, the highest score in the group, while y-cruncher produced the fastest completed results across the table, and 7-Zip decompression reached 117.863 GIPS. The gains over the 14s AMD are not universal, but sustained CPU workloads are where the move to 16 inches pays off most. Battery life also increases slightly to 15 hours and 5 minutes, while the larger QHD+ 120Hz display and full numeric keypad provide considerably more workspace.
Choosing the AMD version over the 16s Intel depends heavily on the applications being used. The Intel model is faster in general productivity, Geekbench, GPU compute, Blender GPU rendering, most local AI workloads, BRAW decoding, and storage, while its 24-hour and 43-minute battery result is more than nine and a half hours longer. AMD counters with stronger results in several heavily threaded CPU workloads, a win in V-Ray, excellent y-cruncher performance where memory capacity allows the test to run, and a few application-specific graphics wins in SPECviewperf and Topaz. Users whose work revolves around CPU rendering, numerical workloads, compression, or other highly threaded software have good reasons to choose the HX PRO 475, while graphics-heavy and local AI work generally favors the Intel configuration.
The choice between the 16s AMD and 14s AMD is much simpler because their CPU and GPU hardware is essentially the same. The 16s gives up roughly 1.1 lb of portability in exchange for the larger 16-inch display, numeric keypad, slightly longer battery life, and better sustained CPU performance in several tests, while Radeon 890M performance changes very little between the two sizes. Engineers, analysts, developers, and other users who spend most of the day working in the notebook will probably appreciate the extra display and keyboard space, while anyone who carries the system frequently can get very similar overall performance from the lighter 14s AMD.
The Pro Precision 5 16s AMD now sits at #16 on our Laptop Battery Life Leaderboard with its 15 hour 5 minute result, and appears in our Best Mobile Workstations and Best Laptops for Local AI coverage.


 Amazon