

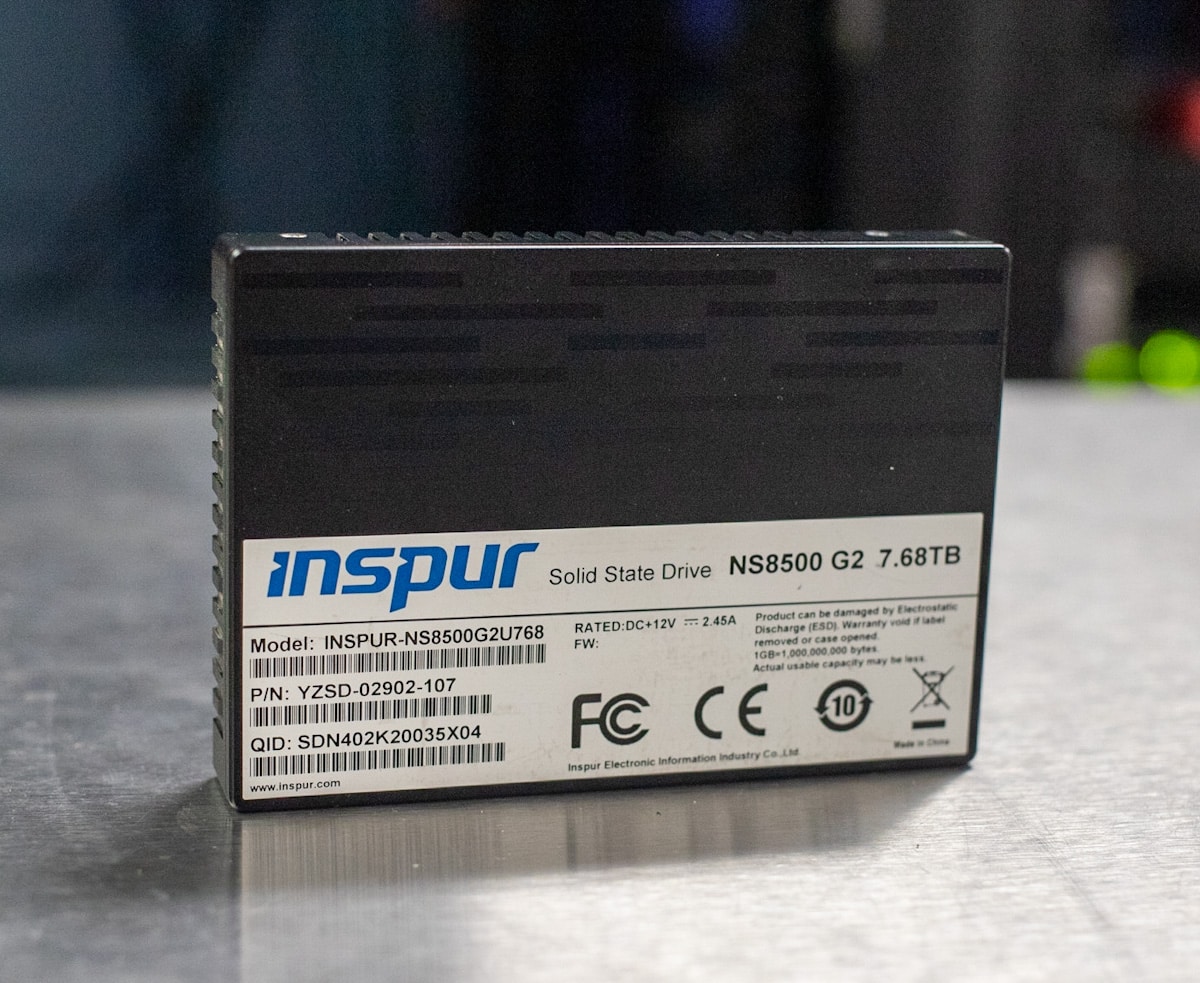
Inspur is one of the world’s largest server vendors. They also have their own storage solutions, of which we’re looking at the NS8500 G2 SSD. This enterprise-grade Gen4 drive uses 112-layer eTLC NAND and Inspur’s own firmware. The drive is aimed at I/O-intense applications requiring low latency.
Inspur NS8500 G2 Specifications
We looked at a batch of the NS8500 G2 SSDs in our Inspur NF5280M6 Server with NS8500 G2 SSDs Performance Report. That article is worth a click for a thorough background on what Inspur offers in this space, especially since we tested the drive (actually, 12 of them) inside one of their servers, but the most important storage-specific details will be repeated below.
Inspur says its second-generation controller in the NS8500 G2 has twice the performance of the first generation, with up to 7GB/s read and 5GB/s write. As noted, this drive uses 112-layer eTLC NAND and a Gen4 interface, so it should be ideal for most enterprise workloads.
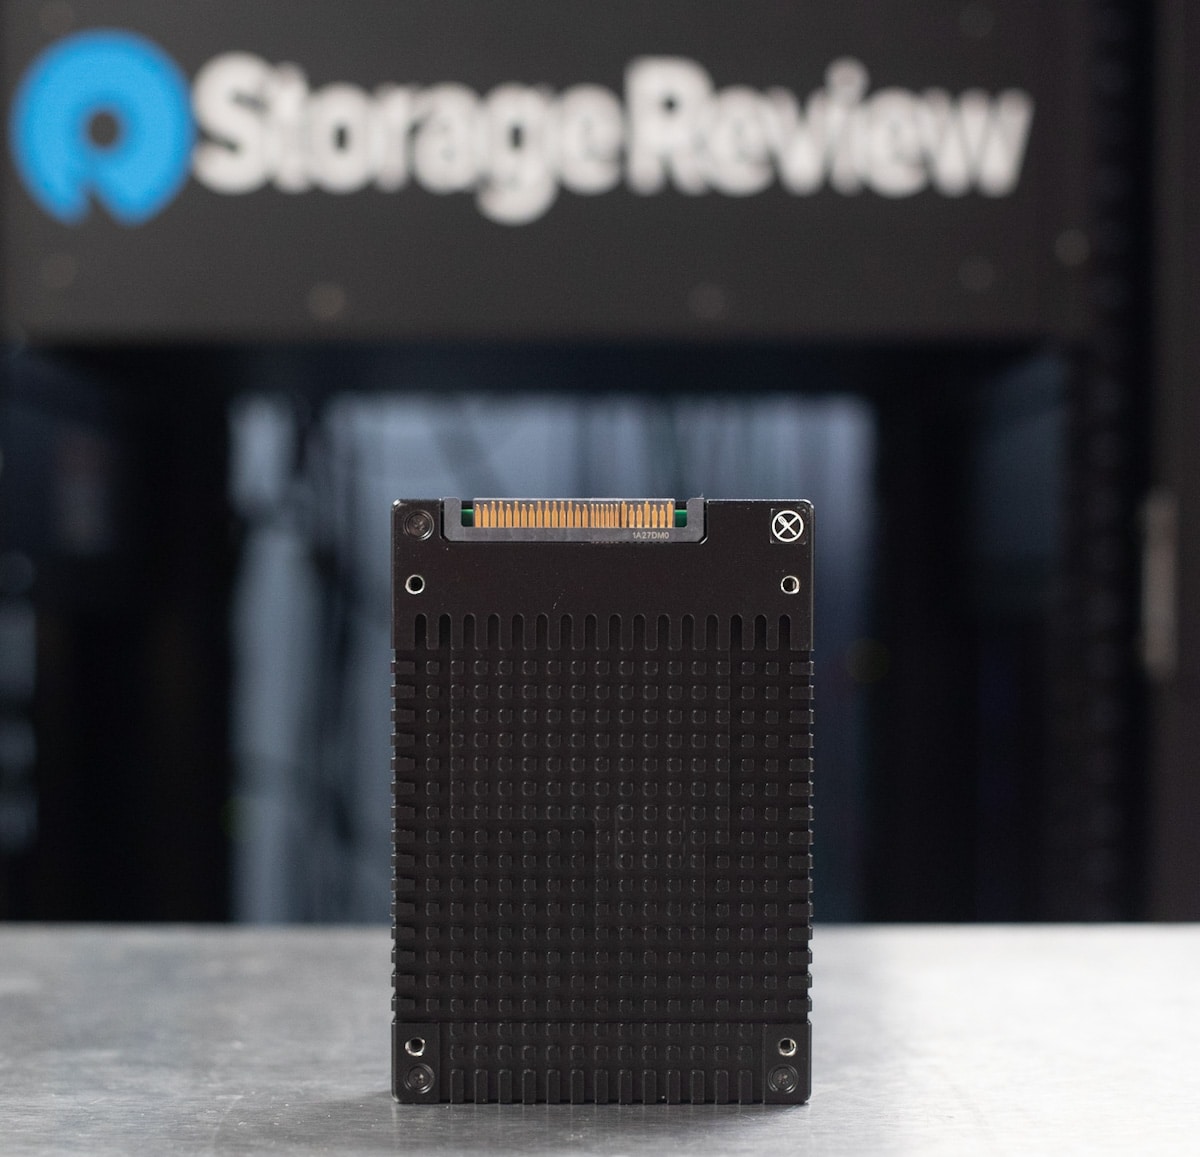
The NS8500 G2 has a 2.5-inch U.2 form factor and is available in 1.92TB, 3.84TB, and 7.68TB capacities. MTBF for all capacities is 2.6 million hours. See the NS8500 G2’s full specifications below.
| Form Factor | 2.5” U.2 | |||
| Host Interface | PCIe 4.0 x4 | |||
| Nand Flash | 112L 3D eTLC NAND | |||
| Performance & Capacity | Capacity | 1.92TB | 3.84TB | 7.68TB |
| Sequential Read (MB/s) | 7000MB/s | 7000MB/s | 7000MB/s | |
| Sequential Write (MB/s) | 2625MB/s | 4500MB/s | 5000MB/s | |
| 4k Random Read IOPS | 1450K | 1450K | 1600K | |
| 4k Random Write IOPS | 126K | 200K | 210K | |
| Read/Write Latency | 11us | 11us | 11us | |
| PBW | 4.34PB | 8.68PB | 17.36PB | |
| MTBF | 2,600,000 hours | |||
| Data Retention | 3 months @40°C | |||
| Operation Temp | 0°C – 70°C | |||
| Storage Temp | -40°C – 85°C | |||
| OS Support | Centos, Ubuntu, Windows, VMware, Red Hat, SUSE, Oracle Linux | |||
| Product Certification | FCC/UL/CB/UNH-IOLCE/REACH/RoHS/VROC/Broadcom RAID card compatibility certification | |||
Inspur NS8500 G2 Performance
Testing Background and Comparables
The StorageReview Enterprise Test Lab provides a flexible architecture for conducting benchmarks of enterprise storage devices in an environment comparable to what administrators encounter in real deployments. The Enterprise Test Lab incorporates a variety of servers, networking, power conditioning, and other network infrastructure that allows our staff to establish real-world conditions to accurately gauge performance during our reviews.
We incorporate these details about the lab environment and protocols into reviews so that IT professionals and those responsible for storage acquisition can understand the conditions under which we have achieved the following results. None of our reviews are paid for or overseen by the manufacturer of the equipment we are testing. Additional details about the StorageReview Enterprise Test Lab and an overview of its networking capabilities are available on those respective pages.
Comparables:
- Dapustor R5100
- Intel P5510
- KIOXIA CD6
- Memblaze PBlaze6 6920
- Micron 9400 Pro
- Samsung PM9A3
- Samsung PM1735
- Solidigm P5520
Testbed
Our PCIe Gen4 Enterprise SSD reviews leverage a Lenovo ThinkSystem SR635 for application tests and synthetic benchmarks. The ThinkSystem SR635 is a well-equipped single-CPU AMD platform, offering CPU power well in excess of what’s needed to stress high-performance local storage. Synthetic tests don’t require a lot of CPU resources but still leverage the same Lenovo platform. In both cases, the intent is to showcase local storage in the best light possible that aligns with storage vendor maximum drive specs.
PCIe Gen4 Synthetic and Application Platform (Lenovo ThinkSystem SR635)
- 1 x AMD 7742 (2.25GHz x 64 Cores)
- 8 x 64GB DDR4-3200MHz ECC DRAM
- CentOS 7.7 1908
- ESXi 6.7u3
We are testing the 7.68TB Inspur NS8500 G2.
SQL Server Performance
Each SQL Server VM is configured with two vDisks: 100GB volume for boot and a 500GB volume for the database and log files. From a system resource perspective, we configured each VM with 8 vCPUs, 64GB of DRAM and leveraged the LSI Logic SAS SCSI controller. While our Sysbench workloads tested previously saturated the platform in both storage I/O and capacity, the SQL test is looking for latency performance.
This test uses SQL Server 2014 running on Windows Server 2012 R2 guest VMs and is stressed by Quest’s Benchmark Factory for Databases. StorageReview’s Microsoft SQL Server OLTP testing protocol employs the current draft of the Transaction Processing Performance Council’s Benchmark C (TPC-C), an online transaction-processing benchmark that simulates the activities found in complex application environments. The TPC-C benchmark comes closer than synthetic performance benchmarks to gauging the performance strengths and bottlenecks of storage infrastructure in database environments. Each instance of our SQL Server VM for this review uses a 333GB (1,500 scale) SQL Server database and measures the transactional performance and latency under a load of 15,000 virtual users.
SQL Server Testing Configuration (per VM)
- Windows Server 2012 R2
- Storage Footprint: 600GB allocated, 500GB used
- SQL Server 2014
-
- Database Size: 1,500 scale
-
- Virtual Client Load: 15,000
-
- RAM Buffer: 48GB
- Test Length: 3 hours
-
- 2.5 hours preconditioning
-
- 30 minutes sample period
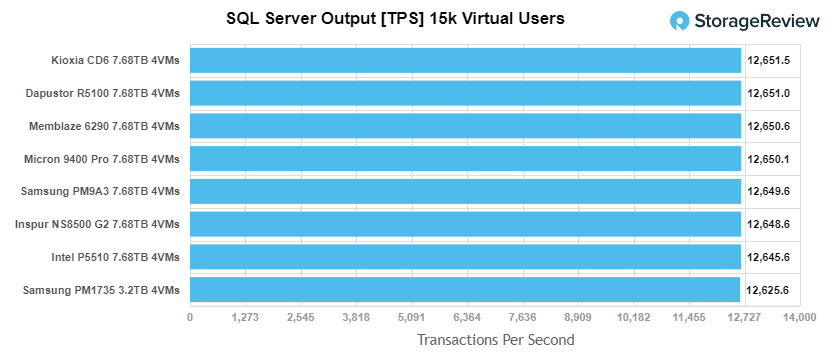
The NS8500 G2 started with 12,648.6 TPS in our SQL Server transactional benchmark, placing it about mid-pack in this tight group.
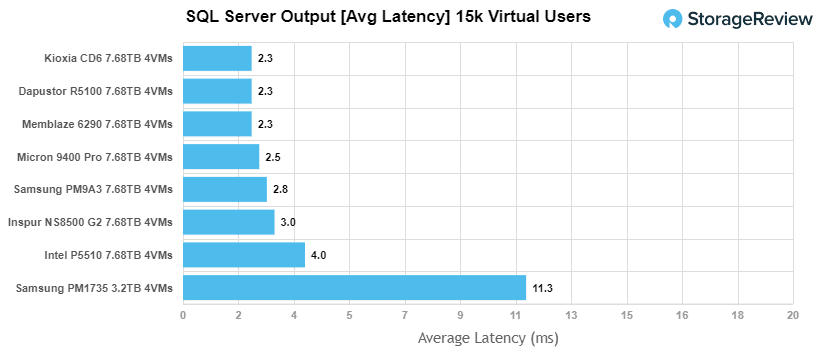
Next is SQL Server average latency, where the NS8500 G2 made another mid-pack showing, only beating the Intel P5510 and the Samsung PM1735.
Sysbench Performance
The next application benchmark consists of a Percona MySQL OLTP database measured via SysBench. This test measures average TPS (Transactions Per Second), average latency, and average 99th percentile latency as well.
Each Sysbench VM is configured with three vDisks: one for boot (~92GB), one with the pre-built database (~447GB), and the third for the database under test (270GB). From a system resource perspective, we configured each VM with 8 vCPUs, 60GB of DRAM and leveraged the LSI Logic SAS SCSI controller.
Sysbench Testing Configuration (per VM)
- CentOS 6.3 64-bit
- Percona XtraDB 5.5.30-rel30.1
- Database Tables: 100
- Database Size: 10,000,000
- Database Threads: 32
- RAM Buffer: 24GB
- Test Length: 3 hours
- 2 hours preconditioning 32 threads
- 1 hour 32 threads
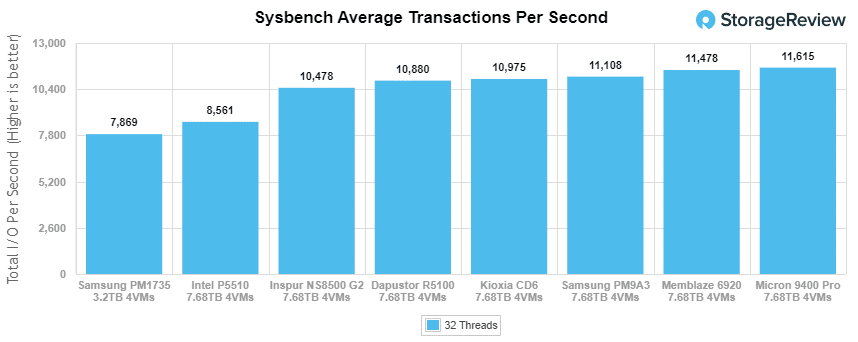
The NS8500 G2 just trails the Dapustor R5100 in our Sysbench transactional benchmark, with 10,478 TPS.
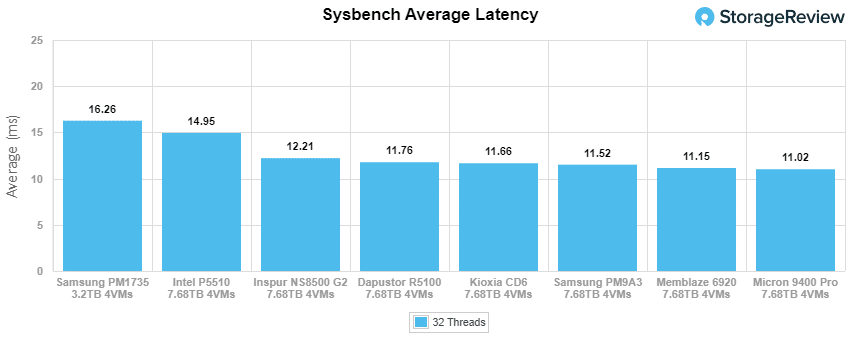
The NS8500 G2’s 12.21ms in Sysbench average latency continues to be good enough for mid-pack, again just trailing the Dapustor R5100. The Micron 9400 Pro continues to lead.
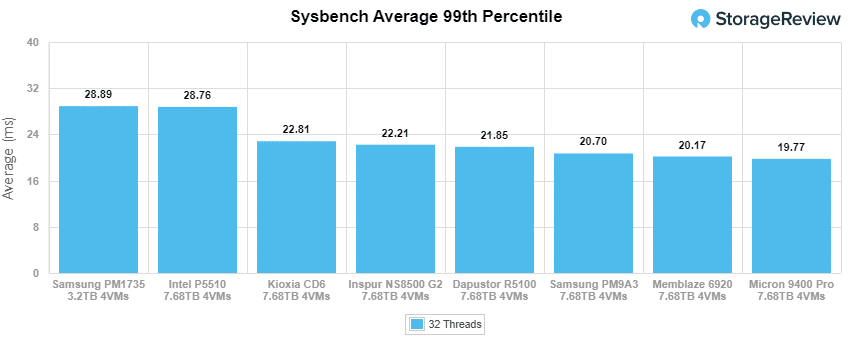
Our worst case (99th percentile) Sysbench test sees the NS8500 G2 improving its standing a bit, now edging out the Kioxia CD6.
VDBench Workload Analysis
When it comes to benchmarking storage devices, application testing is best, and synthetic testing comes in second place. While not a perfect representation of actual workloads, synthetic tests do help to baseline storage devices with a repeatability factor that makes it easy to do apples-to-apples comparisons between competing solutions. These workloads offer a range of different testing profiles ranging from “four corners” tests, common database transfer size tests, to trace captures from different VDI environments.
All of these tests leverage the common vdBench workload generator, with a scripting engine to automate and capture results over a large compute testing cluster. This allows us to repeat the same workloads across a wide range of storage devices, including flash arrays and individual storage devices. Our testing process for these benchmarks fills the entire drive surface with data, and then partitions a drive section equal to 25% of the drive capacity to simulate how the drive might respond to application workloads. This is different from full entropy tests which use 100% of the drive and takes them into a steady state. As a result, these figures will reflect higher-sustained write speeds.
Profiles:
- 4K Random Read: 100% Read, 128 threads, 0-120% iorate
- 4K Random Write: 100% Write, 128 threads, 0-120% iorate
- 16K Sequential Read: 100% Read, 32 threads, 0-120% iorate
- 16K Sequential Write: 100% Write, 16 threads, 0-120% iorate
- 64K Sequential Read: 100% Read, 32 threads, 0-120% iorate
- 64K Sequential Write: 100% Write, 16 threads, 0-120% iorate
- 4K, 8K, and 16K 70R/30W Random Mix, 64 threads, 0-120% iorate
- Synthetic Database: SQL and Oracle
- VDI Full Clone and Linked Clone Traces
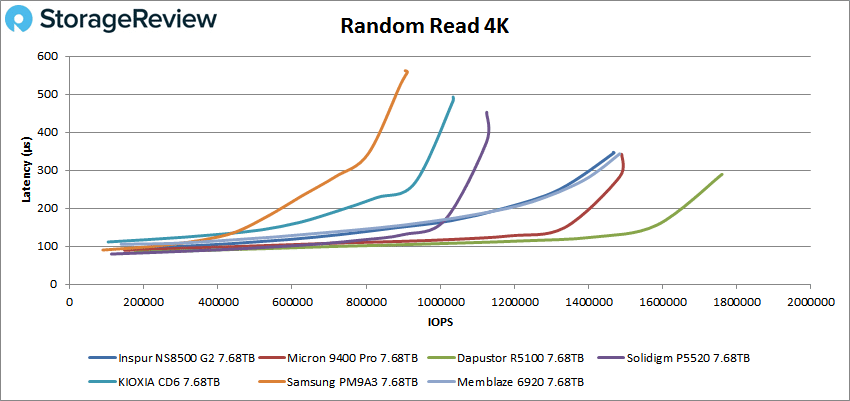
Our first VDBench test is random read 4K. The NS8500 G2 maintained its mid-pack position and finished at 1,467,450 IOPS at 347µs. It couldn’t catch the Dapustor R5100, which achieved 1,760,209 IOPS at 289µs.
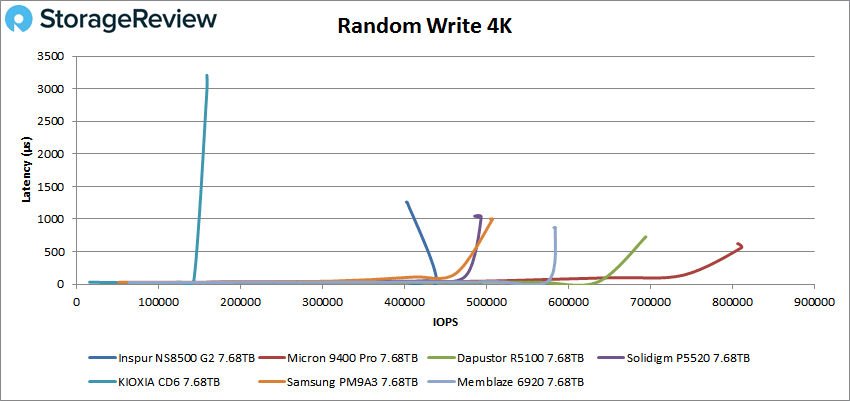
Like the other drives, the NS8500 G2 ran into a latency spike in random write 4K. Its best pre-spike number was 439,232 IOPS at just 48.4µs. The Dapustor R5100 or the Micron 9400 Pro remain out of its reach.
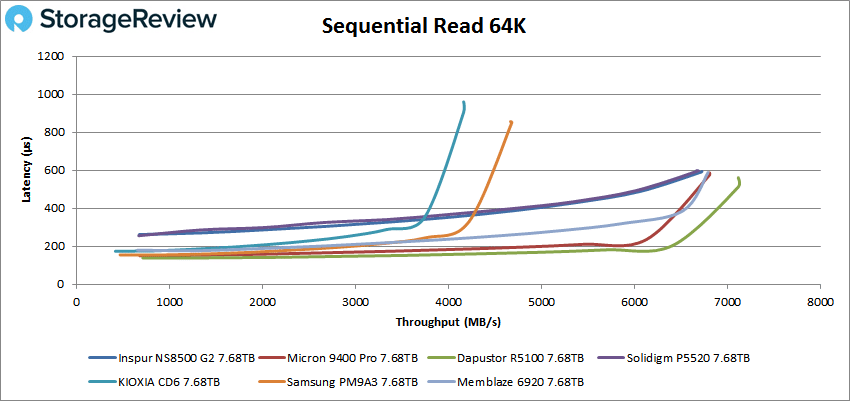
Next are our sequential tests, starting with read. The NS8500 G2’s graph line is almost the same as that of the Solidigm P5520, peaking at 6,720MB/s at 594µs.
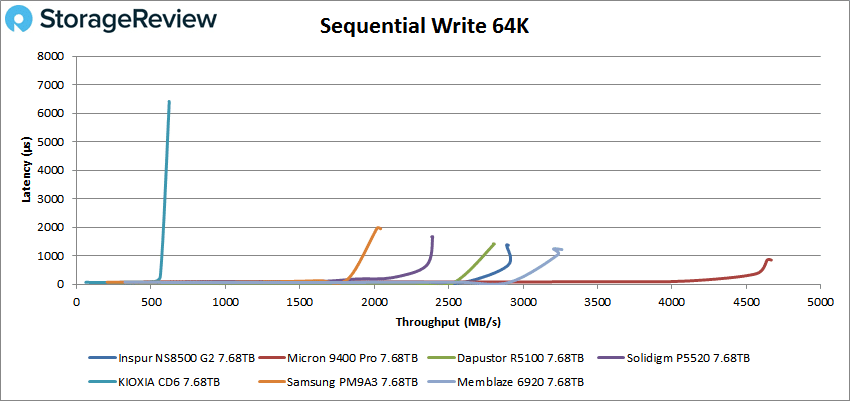
The NS8500 G2 fared well in sequential write 64K, hitting 2,897MB/s at 653µs before the latency spike. Only the Memblaze 6920 and the Micron 9400 Pro did better. Notably, the NS8500 G2 beat out the Dapustor R5100.
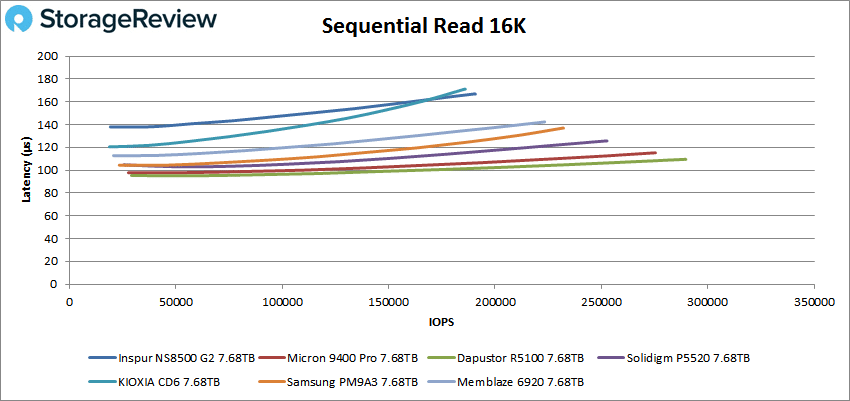
Let’s move on to the 16K tests. The NS8500 G2 didn’t do too well in the read test, finishing at 190,724 IOPS at 167µs. Only the Kioxia CD6 fared marginally worse.
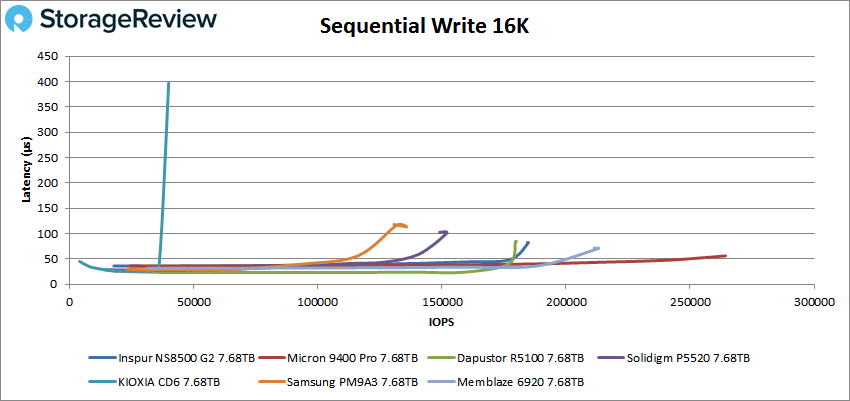
The NS8500 G2 redeemed itself in sequential write 16K, achieving 184,492 IOPS at just 82.3µs without a major latency spike or instability as many of the other drives showed. The Dapustor R5100 took a back seat in this test, too.
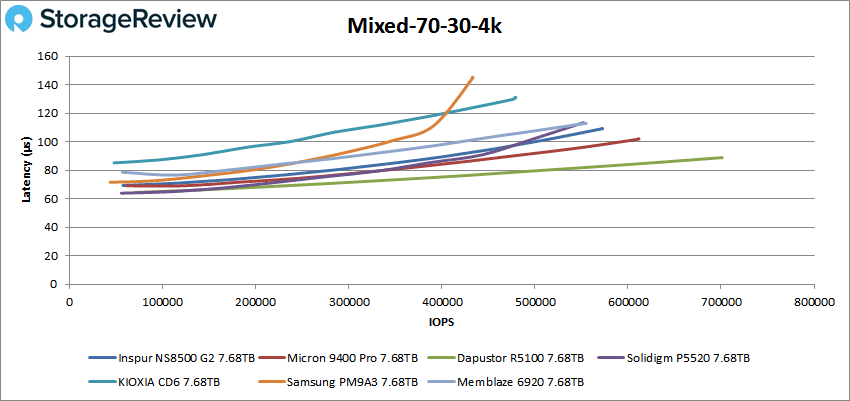
Now for our mixed read/write profiles, starting with 70/30 4K. It was status quo for the NS8500 G2, which isn’t a bad thing as its performance has been very stable throughout our tests so far. It finished behind the Dapustor R5100 and the Micron 9400 Pro with 571,812 IOPS at 109µs.
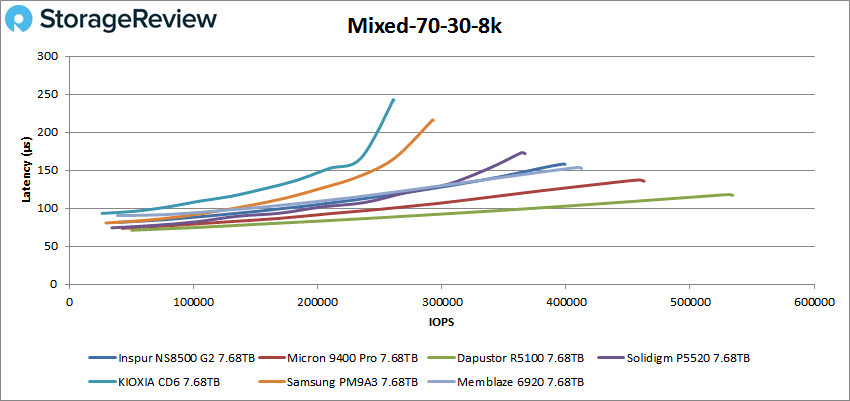
The NS8500 G2 maintained its mid-pack performance in the mixed 8K profile, finishing at 399,186 IOPS at 158µs.
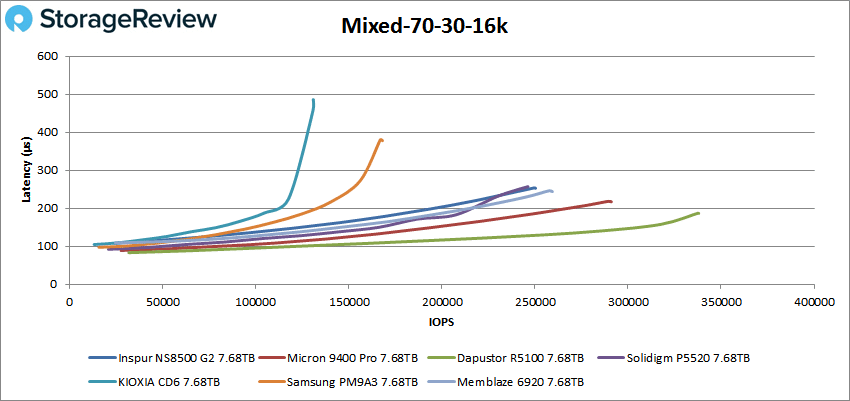
Not much changes with the NS8500 G2’s relative performance in the 70/30 16K profile, though the Kioxia CD6 and the Samsung PM9A3 drop off considerably. The NS8500 G2 stays in the middle, completing the test at 250,320 IOPS at 253µs.
That’s all for the mixed workloads, so it’s on to the database testing, starting with SQL Workload. The NS8500 G2 didn’t touch the leading Dapustor R5100, Micron 9400 Pro, or the Solidigm P5520, and sat in the back half of the group with a final number of 270,689 IOPS at 117µs. The leading drives didn’t break 100µs.
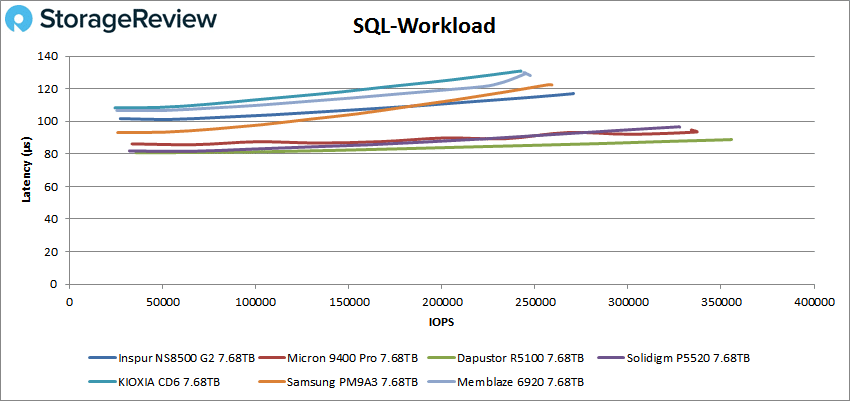
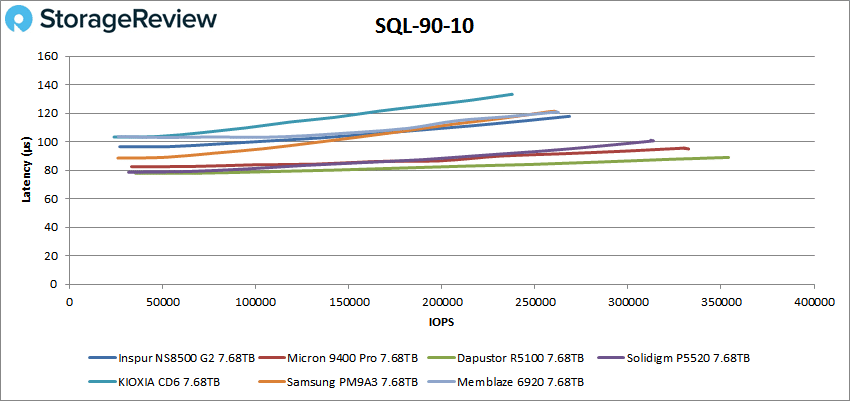
The NS8500 G2’s continued its consistent performance in SQL 90-10, completing the test at 268,235 IOPS at 118µs.
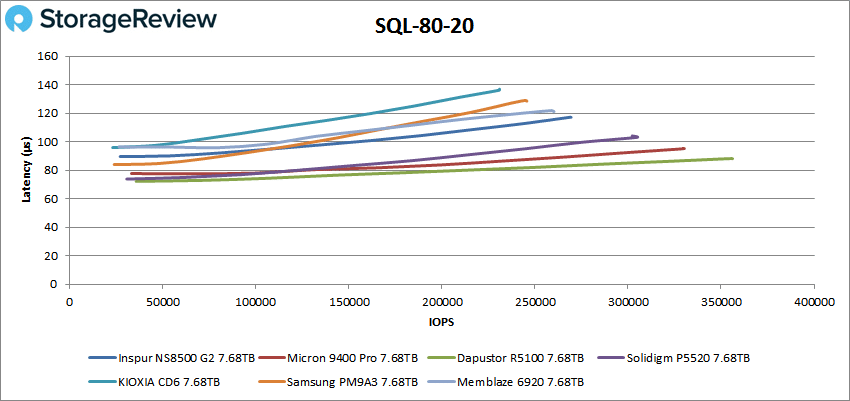
Steady as she goes is the NS8500 G2’s motto, where again it shows solid mid-pack performance in SQL 80-20. It finished ahead of the Memblaze 6920 at 269,241 IOPS at 117µs. Only the Dapustor R5100 and the Micron 9400 Pro stayed sub-100µs.
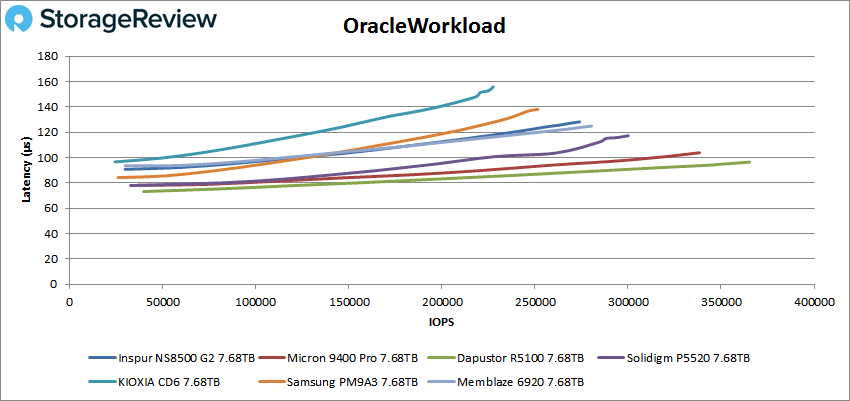
Now for our Oracle tests, starting with Oracle Workload. Several of the drives showed minor instability, but not the rock solid NS8500 G2! It reliably finished mid-pack, with a final number of 273,976 IOPS at 128µs.
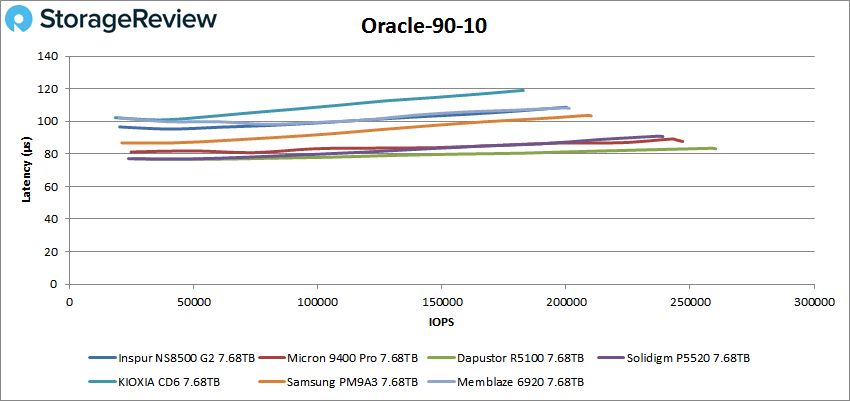
The lines for all the drives smoothed out in Oracle 90-10. The NS8500 G2 is hard to distinguish from the Memblaze 6920; its best number was 200,413 IOPS at 109µs. The Dapustor R5100 remained uncatchable.
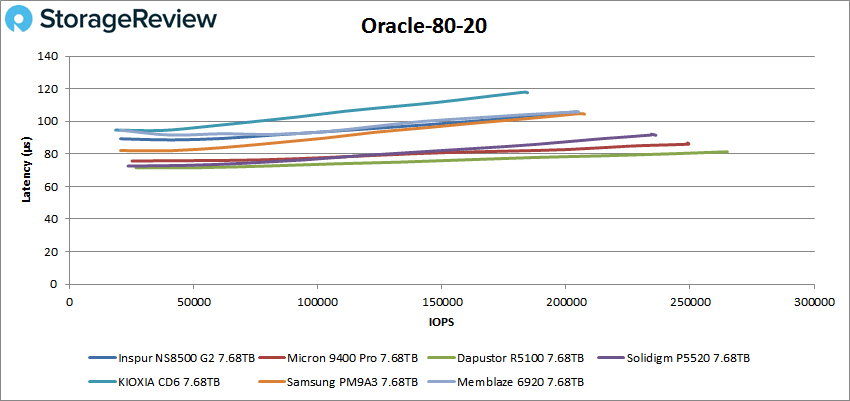
The last database test is Oracle 80-20. The NS8500 G2 again performed like Memblaze 6920 and this time, the Samsung PM9A3, too. It finished the test at 204,694 IOPS at 106µs.
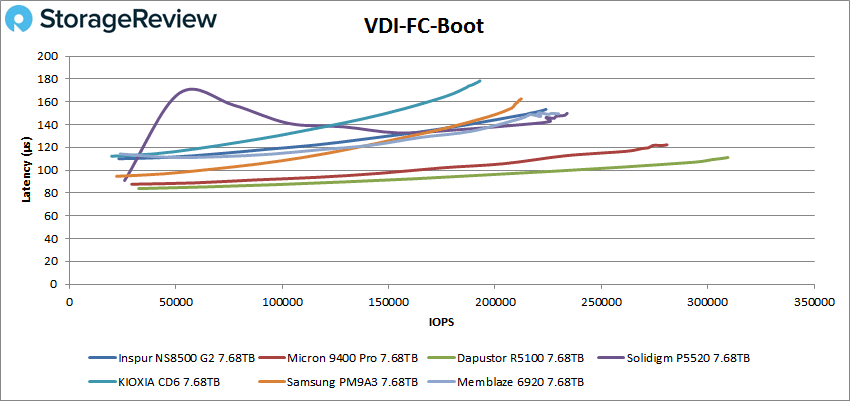
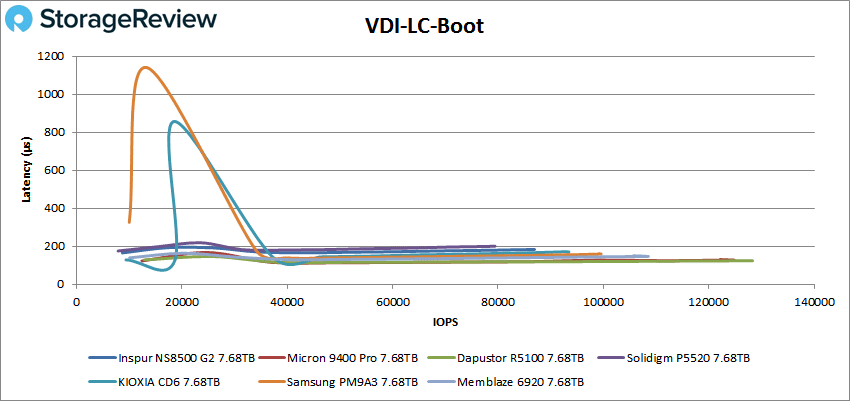
Our final series of tests are VDI full clone (FC) and linked clone (LC). We start with VDI FC boot, where the NS8500 G2 showed a nice steady line through the middle of this group. Its top number was 223,972 IOPS at 153µs. There continued to be no catching the Micron 9400 Pro or the Dapustor R5100.
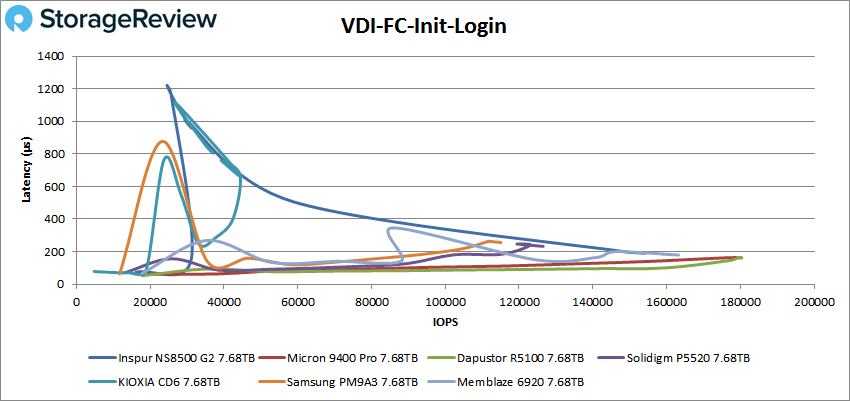
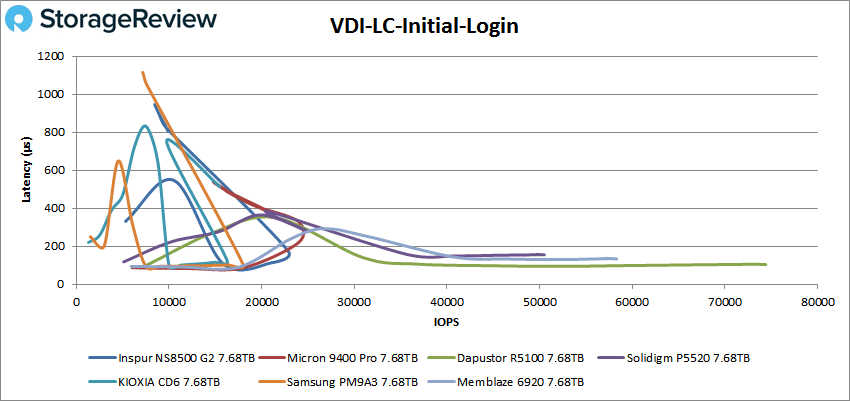
The crazy-looking graph for VDI FC Initial Login is the norm for this test. The NS8500 G2 took an early latency spike before calming down and hitting 153,709 IOPS at 191µs, which wasn’t too far off the Micron 9400 Pro and the Dapustor R5100.
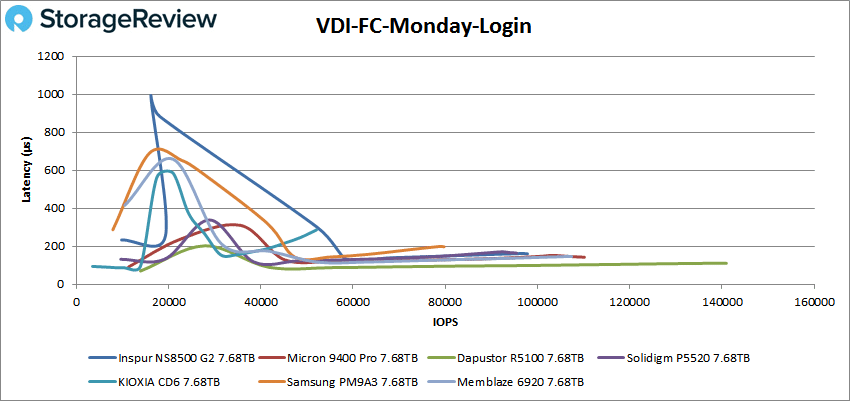
The squiggly lines got worse in the tougher VDI FC Monday Login test. The NS8500 G2 stayed about where it was relative to the other drives, and finished at 97,505 IOPS at 161µs. The Memblaze 6920 just edged it out.
The VDI Linked Clone (LC) tests are next. Consistency is the NS8500 G2’s mantra, and it doesn’t disappoint, with a steady line that ends at 86,813 IOPS at 183µs. In a rare moment, the Kioxia CD6 did better, but its line started with a big spike where the NS8500 G2 showed none.
VDI LC Initial Login saw the NS8500 G2 not quite keeping its cool, with a big latency spike that never quite came down. It hit 22,850 IOPS at 175µs before the spike and finished at just 8,430 IOPS at 946µs.
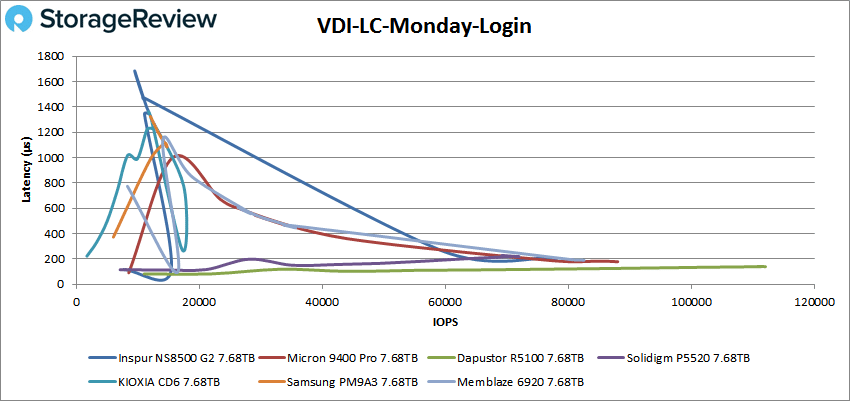
The NS8500 G2 turned things around in our last test, VDI LC Monday Login. It began with high latencies but quickly recovered and finished strongly at 78,094 IOPS at 201µs. That’s not far off the Micron 9400, which finished at 87,563 IOPS at 179µs.
Final Thoughts
The Inspur NS8500 G2 proved itself as a solid, reliable performer throughout our enterprise benchmarks. It’s not in the same performance league as the Micron 9400 Pro and the Dapustor R5100, but its middle-of-the-pack performance didn’t disappoint. It maintained stable performance in our Oracle database and VDI Full Clone tests where our comparison drives, including the Kioxia CD6 and even the Micron 9400 Pro, tended to show some instability. Stability and predictability are the NS8500 G2’s calling cards.
Performance highlights for the 7.68TB NS8500 G2 include 12,649 TPS in SQL Server with 15K virtual users, 10,478 TPS in Sysbench, 1,760,209 IOPS in 4K random read, 439,232 IOPS in 4K random write, and 571,812 IOPS in our mixed 70/30 4K test. It was commendably stable in our SQL and Oracle database tests and held itself together well in our VDI testing. None of our tests suggested the NS8500 G2 is ill-suited for any enterprise workload.
The Memblaze 6920 performs similarly to the NS8500 G2, though its performance isn’t as consistent. As noted, the Micron 9400 Pro and the Dapustor R5100 are both superior performers, but unless you’re continuously running your servers at maximum, the NS8500 G2 is a worthy alternative, especially if you’re using Inspur servers and thus taking advantage of vertical integration for price savings.


 Amazon