

The Dell Pro 14 Premium is what Dell calls its ultimate commercial notebook: a 14-inch, 2.54-pound magnesium flagship aimed at highly mobile professionals rather than workstation users. It sits above the Dell Pro and Dell Pro Plus lines, and the pitch is craftsmanship and portability with enterprise security and manageability underneath, not raw compute. The chassis is 90% recycled magnesium, the battery is customer-replaceable, and the platform includes Intel vPro Enterprise, a FIPS 140-3-certified TPM, and quantum-resistant BIOS verification.
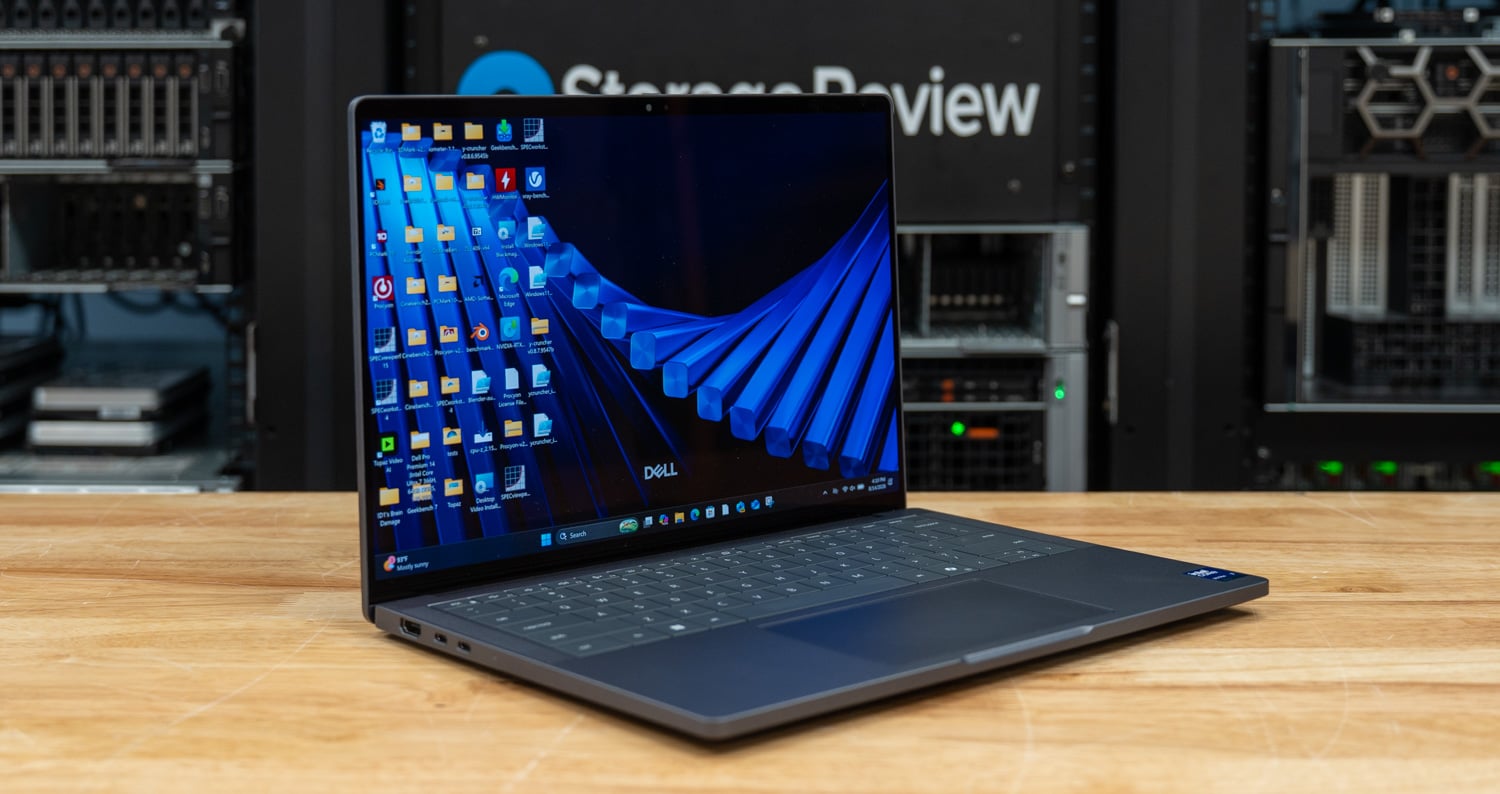
Dell sells the Pro 14 Premium in three processor tiers, all from the Intel Core Ultra Series 3 (Panther Lake): the 8-core Core Ultra 5 335, the 8-core Core Ultra 7 365, and the 16-core Core Ultra 7 366H. Displays range from a 1920 x 1200 WUXGA LCD to a 2880 x 1800 Tandem OLED touch panel, with memory up to 64GB and storage up to 2TB. Our review unit is essentially the ceiling of the configurator: the 366H with its 50 TOPS NPU, 64GB of LPDDR5x at 8533 MT/s, a 1 TB TLC SSD, and the Tandem OLED touch display. That configuration starts at $2,409 and prices out at $5,219 as tested on Dell.com, though single-unit pricing is a reference point here; this machine is built to be bought in fleet volume through an account team.
All three CPUs share the same integrated Intel Graphics, so unlike the HP EliteBook X G2i, which offers a 12 Xe-core Arc B390 step-up on its top silicon, there is no faster graphics tier hiding above this build. The 4 Xe-core iGPU is the ceiling for the whole line, and that shapes what this machine is for: dense office multitasking, collaboration, and on-device AI, not GPU rendering or CAD viewports. We tested the best build Dell makes, and the results below show exactly where that ceiling sits.
Dell Pro 14 Premium Specifications
| Specification | Dell Pro 14 Premium |
|---|---|
| Model | Dell Pro 14 Premium (PA14260) |
| Processor | Intel Core Ultra 7 366H vPro Enterprise (Series 3), 16 cores / 16 threads, 50 TOPS Intel AI Boost NPU |
| Graphics | Integrated Intel Graphics, 4 Xe cores |
| Memory | 64GB LPDDR5x, 8533 MT/s, dual-channel, onboard |
| Storage | 1TB TLC SSD (Samsung PM9C1b, PCIe Gen4 NVMe) |
| Display | 14-inch WQXGA (2880 x 1800) Tandem OLED touch, 400 nits, 100% DCI-P3, ComfortView Plus, anti-reflective/anti-smudge, Gorilla Glass |
| Camera | 8MP HDR + IR, 1440p at 30 fps, presence detection, temporal noise reduction, camera shutter |
| Wireless | Intel Wi-Fi 7 BE211 2×2, Bluetooth 6.0 |
| Keyboard | Zero-Lattice mini-LED backlit with Copilot hotkey |
| Ports | 2x Thunderbolt 4 / USB4 (40Gbps) with Power Delivery 1x USB 3.2 Gen 1 Type-A 1x HDMI 2.1 1x 3.5mm headset jack |
| Battery | 3-cell, 60Wh, ExpressCharge and ExpressCharge Boost (40Wh 2-cell on base configs) |
| Power Adapter | 65W USB-C |
| Security | Fingerprint reader, Windows Hello IR camera, TPM 2.0 (FIPS 140-3 certified), quantum-resistant BIOS verification, camera shutter |
| Chassis | 90% recycled magnesium, starting at 2.54 lb (1.15 kg), 12.25 x 8.53 x 0.66-0.78 inches |
| Operating System | Windows 11 Pro, Copilot+ PC |
| Warranty | 36-month limited hardware warranty |
| Price | $2,409 starting; $5,219 as tested (single-unit Dell.com) |
Build and Design
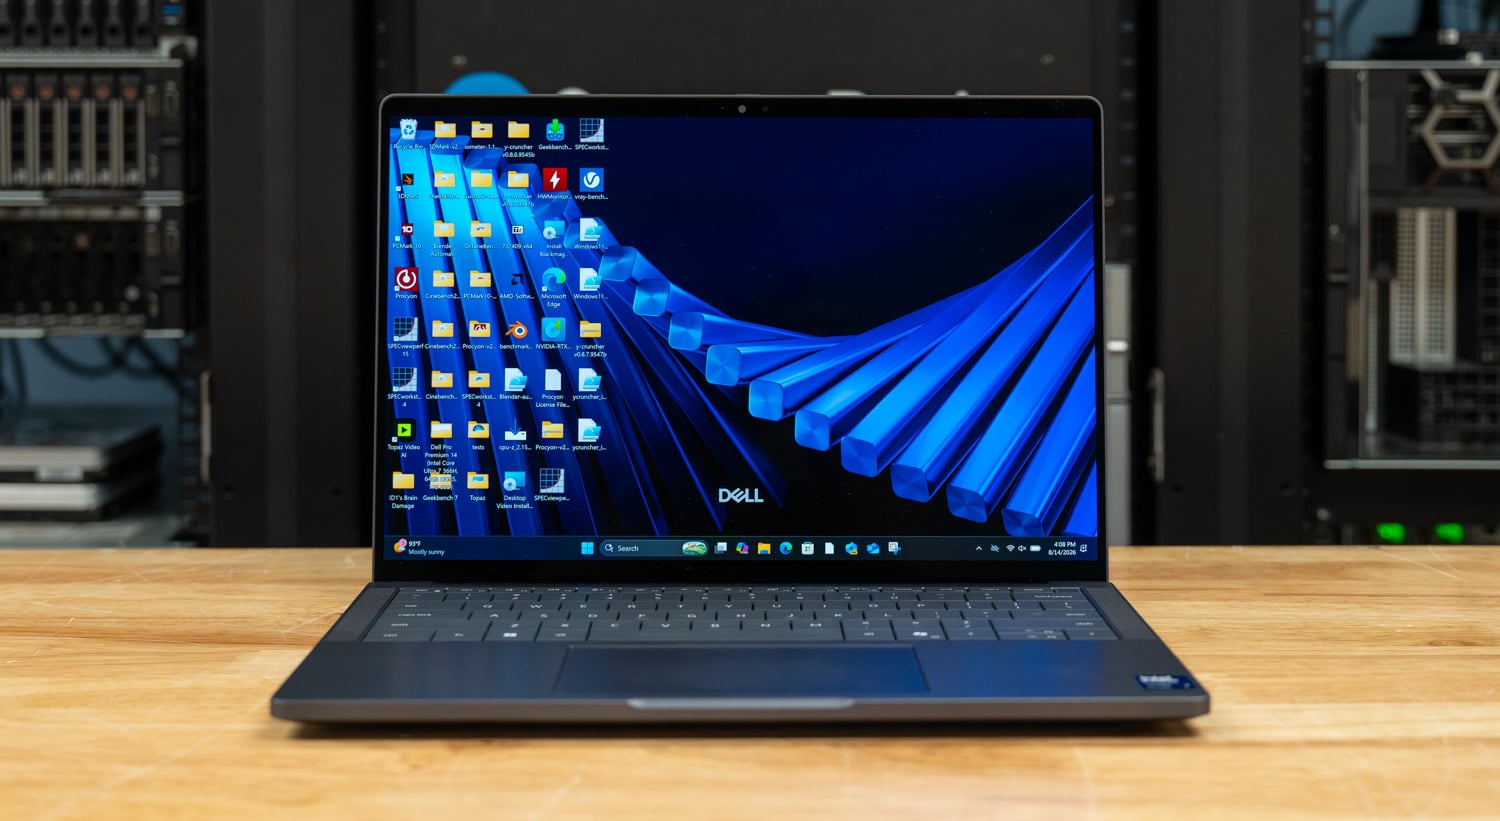
Weighing in at only 2.55 pounds thanks to Dell’s 90% recycled magnesium chassis, the Pro 14 Premium carries well in hand and keeps your bag light. The chassis also provides enough rigidity to open the lid from a corner without major deformation.
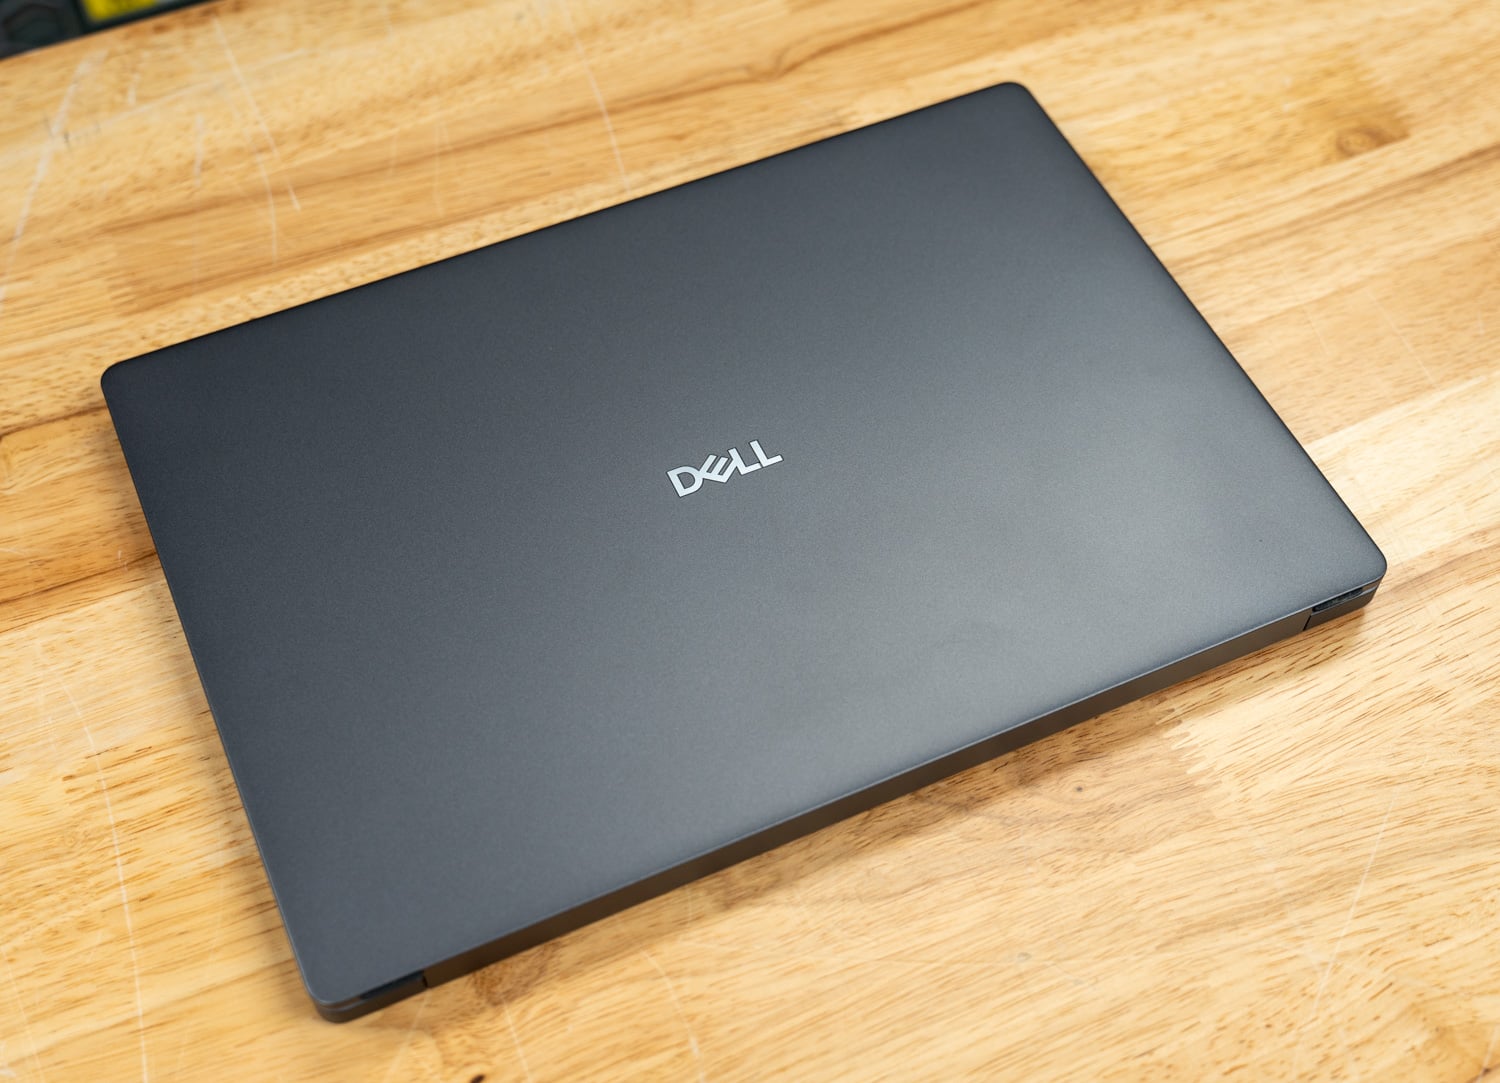
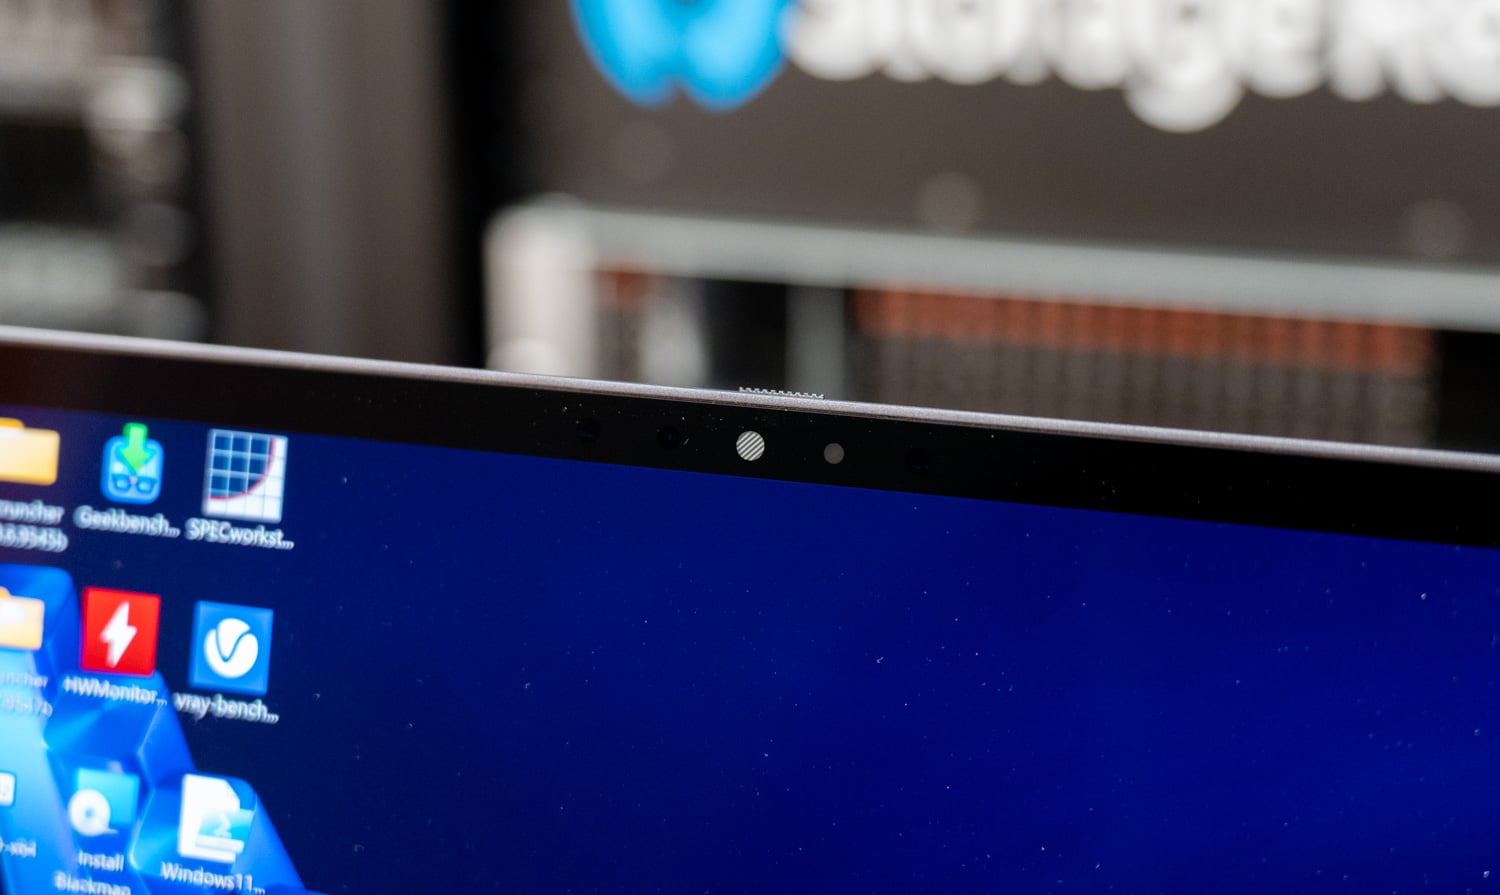
Along the front edge, the Pro 14 Premium sits just under 3/4 inch high across the entire chassis. The knurled slider for the webcam shutter is also visible and centered between the stereo microphones.

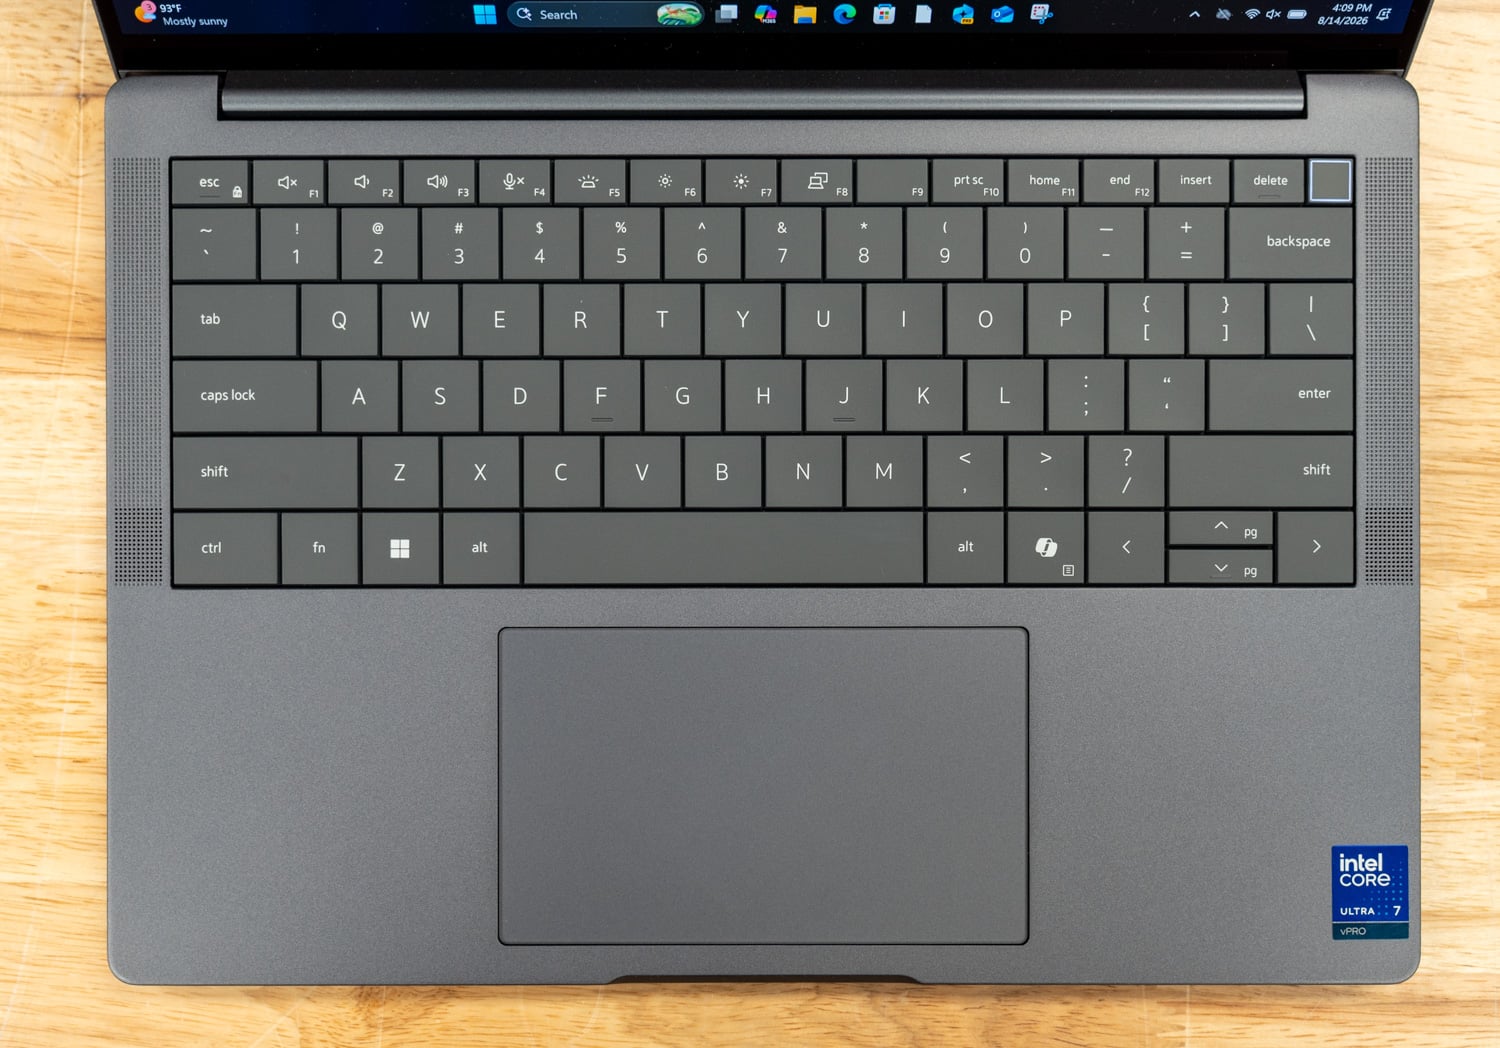
Similar to our previous Pro Precision 7 16, we see the same tightly placed key layout, with minimal gaps. We also see the set of top-firing speakers that are only half of the sound setup. There is another pair of bottom-firing speakers along the front edge on either side of the touchpad. This keyboard also features a zero-lattice mini-LED backlight to aid low-light usage.
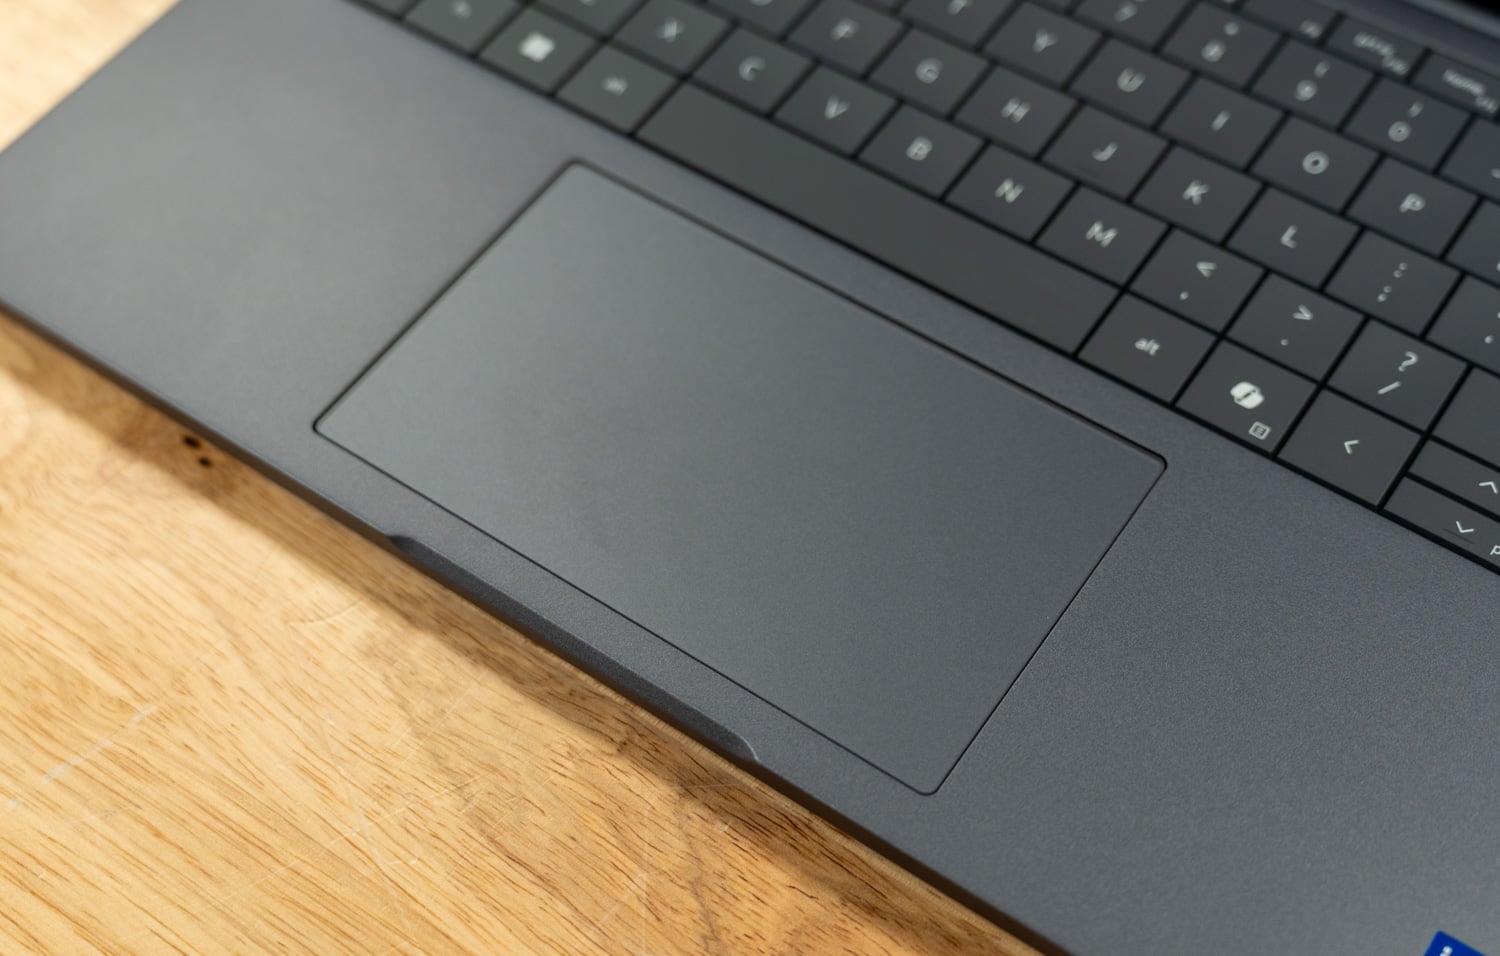
This model also features a glass touchpad, like another flashback to the Pro Precision 7 16, but this time it is a traditional diving-board-hinge-style touchpad, not haptic. Though it is not haptic, it does have the same smooth finish and sliding feel. Some configurations of the Pro 14 Premium also feature the collaboration touchpad for easy meeting controls.
For the display, we have a 3K tandem OLED with a Gorilla Glass touch panel across the top. The display outputs 400 nits at 100% brightness and features an anti-smudge coating. The use of tandem OLED displays helps not only with color clarity but also with power efficiency and display longevity. According to Dell’s numbers, the tandem OLED reduces weight by 49% compared to a traditional OLED panel and is 24% more power-efficient.
Above the 3K tandem OLED display, we can see the camera and sensor package. This houses the 8MP 1440p webcam along with the Windows Hello and presence detection sensors. This notebook also features an integral shutter with a knurled slider on the top edge, as opposed to on the front edge, like some other notebooks we’ve seen.
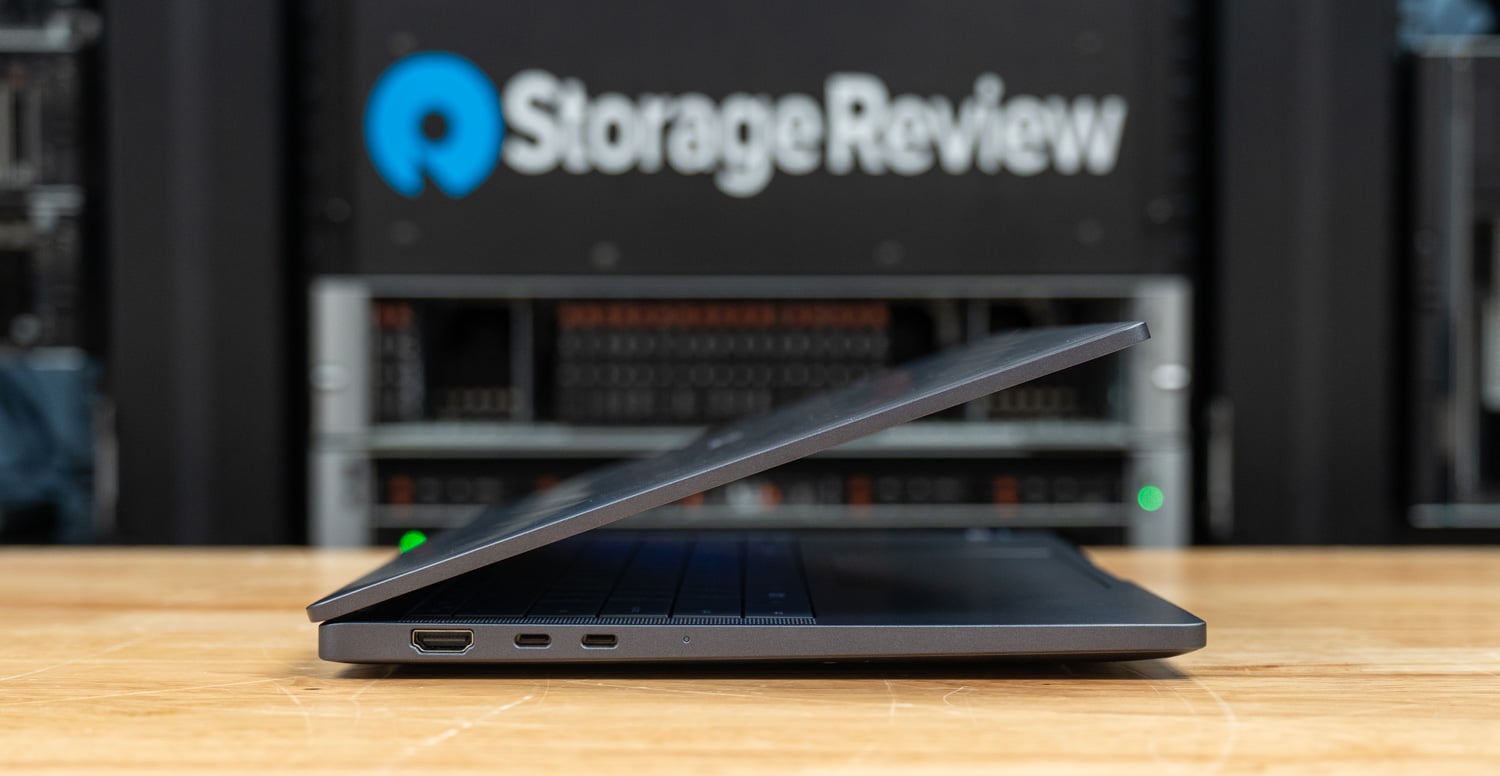
Taking a look at our port selection, the left edge features the HDMI 2.1 port and both of the Thunderbolt 4 ports, alongside a charge indicator light.
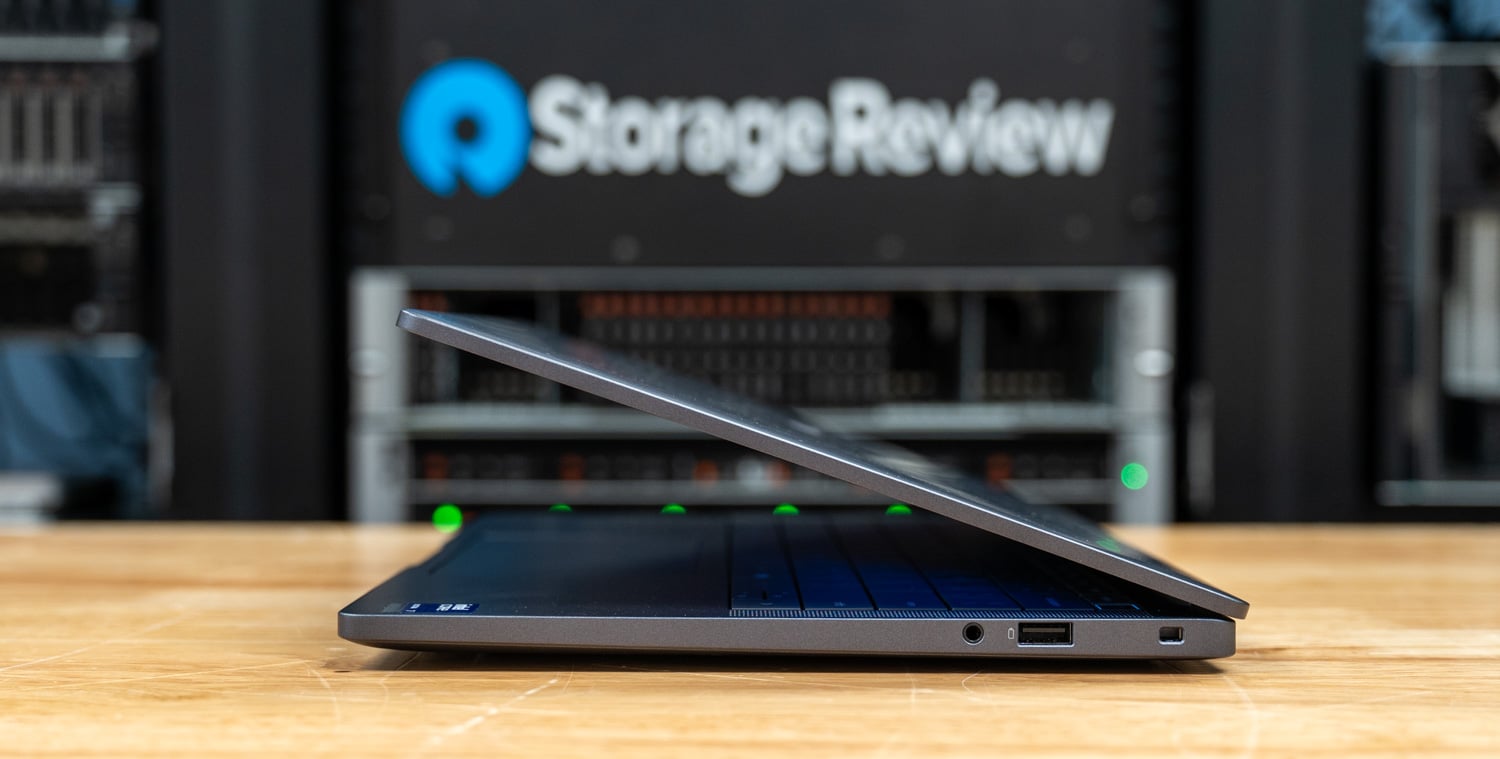
Along the right edge, it is a little sparser; we have the 3.5mm combination headphone jack, a USB 3.2 Gen 1 Type-A port, and the wedge-shaped lock slot. The USB Type-A port also supports Dell’s Power Share feature, which allows power output while the laptop is asleep or even powered off, for charging peripherals or a cell phone.
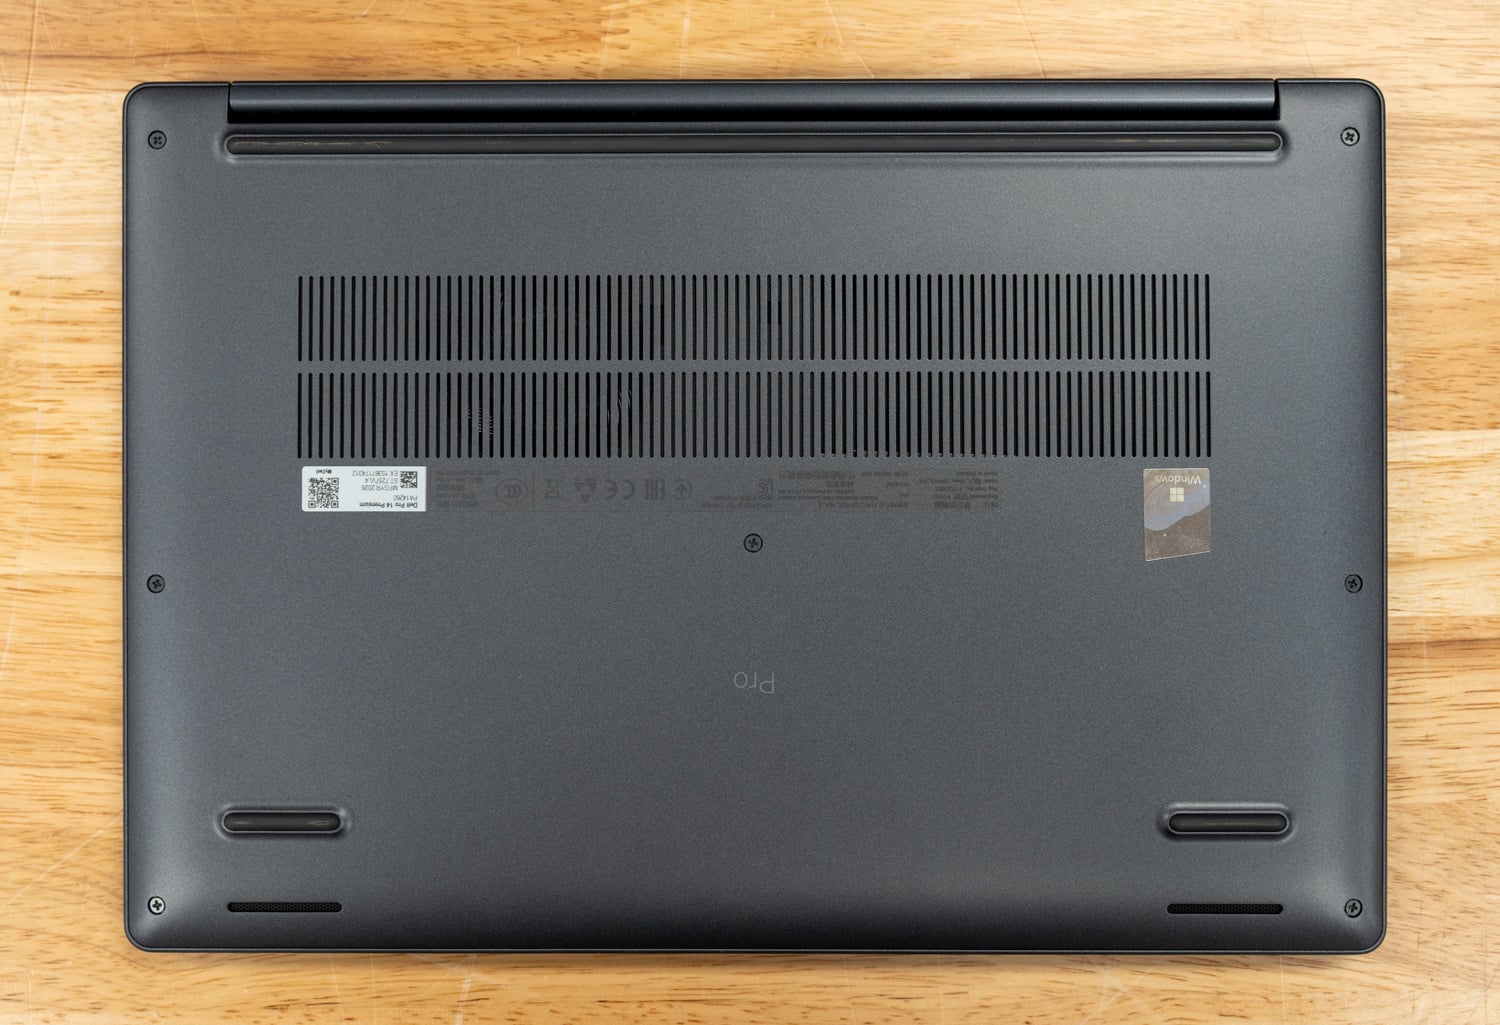
At the bottom, we see a good-sized air intake for the cooling package, with a rear-firing exhaust at the display hinge. Toward the front edge, we also see additional bottom-firing speakers that complement those flanking the keyboard, providing a full sound profile. For serviceability, Dell also only utilizes 7 screws to remove the bottom cover.
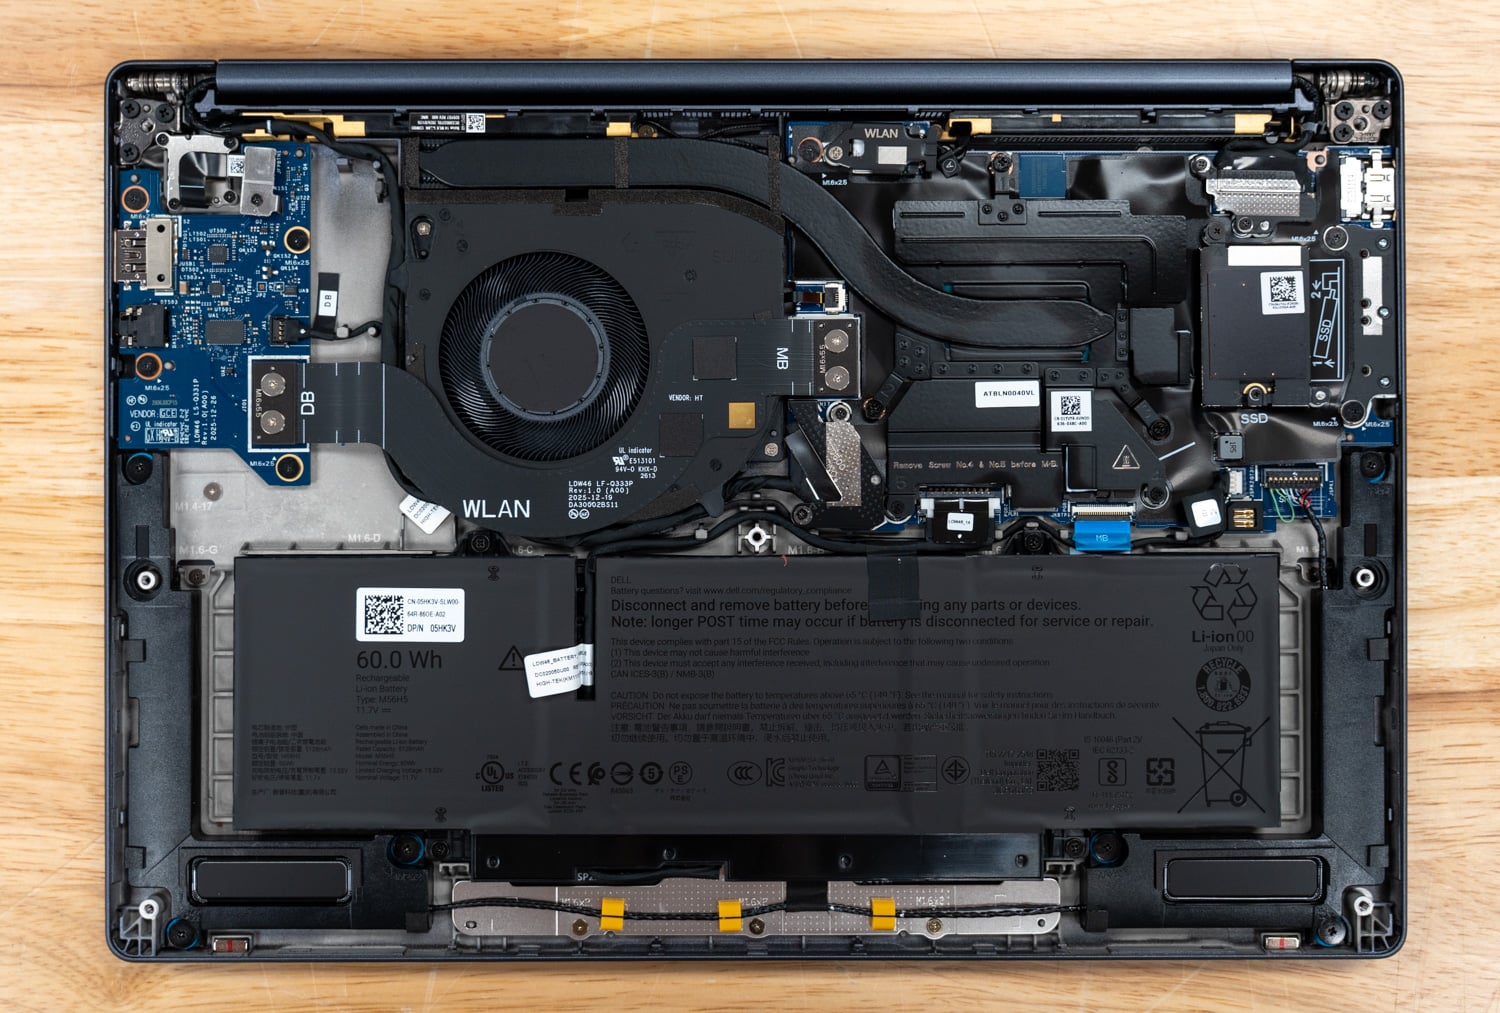
Internally, front and center is the sizeable cooling fan, nearly the same size as the entire mainboard, tucked in the top right. Down below, we also see the 60Wh battery, which has more than enough capacity to run day-to-day tasks in balanced power mode throughout the workday. Dell has also leaned heavily into serviceability, with the SSD and battery being easily replaceable.
Dell Pro 14 Premium Performance
Our review unit runs the Core Ultra 7 366H with integrated Intel Graphics, 64GB of LPDDR5x at 8533 MT/s, and a 1 TB TLC SSD on Windows 11 Pro, with benchmarks tested in the Best Performance power mode. For battery life testing, we configure systems into Balanced power mode and set the screen brightness to 50%.
For comparisons, we lined the Pro 14 Premium up against three systems tested with the same suite, which run the identical Core Ultra 7 366H: the HP EliteBook X G2i, its closest cross-brand rival in the premium commercial 14-inch class, and the Dell Pro 7 14 Intel, the mainstream Dell Pro that shows what the Premium buys you over the volume line. The third is the Lenovo ThinkPad P14s Gen 7, a 3.6-pound mobile workstation on the same Panther Lake silicon with a discrete RTX PRO 1000; it is a class heavier, but it brackets what a dedicated GPU adds over this iGPU platform.
PCMark 10
PCMark 10 simulates a full day of office work: app start-up, video conferencing, web browsing, spreadsheets, writing, photo and video editing, and light rendering.
| PCMark 10 (higher is better) | Dell Pro 14 Premium | HP EliteBook X G2i | Dell Pro 7 14 Intel | Lenovo ThinkPad P14s Gen 7 |
|---|---|---|---|---|
| Overall Score | 8,482 | 9,209 | 8,438 | 9,083 |
| Essentials | 10,840 | 10,760 | 10,981 | 10,686 |
| Productivity | 14,466 | 18,859 | 13,992 | 16,501 |
| Digital Content Creation | 10,558 | 10,445 | 10,610 | 11,534 |
The Pro 14 Premium lands at 8,482 overall, ahead of the Dell Pro 7 14 Intel at 8,438 but behind the HP EliteBook X G2i at 9,209 and the ThinkPad P14s Gen 7 at 9,083. The gap to the HP is almost entirely the Productivity group, where the EliteBook posts an unusually strong 18,859 against the Dell’s 14,466. Essentials and Digital Content Creation are effectively tied across the three 366H systems, as the shared silicon predicts.
PCMark 10 Modern Office Battery
For battery testing, we run the PCMark 10 Modern Office battery test in Balanced power mode at 50% screen brightness until the system shuts down.
| Modern Office Battery | Dell Pro 14 Premium | HP EliteBook X G2i | Dell Pro 7 14 Intel | Lenovo ThinkPad P14s Gen 7 |
|---|---|---|---|---|
| Runtime (higher is better) | 16 hours 30 minutes | 17 hours 13 minutes | 26 hours 18 minutes | 15 hours 52 minutes |
At 16 hours and 30 minutes, the Pro 14 Premium sits in the same band as the other premium OLED machine in the group; the EliteBook X G2i ran for 17:13 on a 68Wh battery, compared to the Dell’s 60Wh. The Dell Pro 7 14’s 26:18 aspect ratio shows what the same silicon can do behind a lower-resolution LCD, so the ten-hour gap is the price of the 2880 x 1800 Tandem OLED panel, not a platform deficiency. Sixteen and a half hours still clear a full workday with margin, and the panel is the point of this configuration.
Using Dell’s Express Charge feature, we observed recharge times of 0-50% in 23 minutes, 0-80% in 48 minutes, and 0-100% in 1 hour and 33 minutes. For seeing over 16 hours of usable runtime from a full charge, you should be ready for a whole workday of use within 30 minutes and some change starting from 0%
Geekbench 6
Geekbench 6 is a cross-platform benchmark covering single-core, multi-core, and GPU compute workloads.
| Geekbench 6 (higher is better) | Dell Pro 14 Premium (Intel Graphics) | HP EliteBook X G2i (Intel Graphics) | Dell Pro 7 14 Intel (Intel Graphics) | Lenovo ThinkPad P14s Gen 7 (RTX PRO 1000) |
|---|---|---|---|---|
| CPU Single-Core | 2,894 | 2,804 | 2,862 | 2,808 |
| CPU Multi-Core | 16,763 | 16,390 | 16,787 | 16,319 |
| GPU OpenCL | 23,861 | 24,453 | 23,741 | 87,537 |
| GPU Vulkan | 26,456 | 26,528 | 25,533 | 73,204 |
The Premium posts the best single-core score in the 366H group at 2,894 and a multi-core score of 16,763, within about 2.5% of all three comps. GPU compute tells the iGPU story plainly: OpenCL and Vulkan land within a few percent of the HP and the Pro 7 14 on the same 4 Xe-core graphics, while the P14s Gen 7’s RTX PRO 1000 runs roughly three times ahead.
Geekbench 7
Geekbench 7 updates the workloads and scoring scale, so scores are not comparable with Geekbench 6.
| Geekbench 7 (higher is better) | Dell Pro 14 Premium (Intel Graphics) | HP EliteBook X G2i (Intel Graphics) | Dell Pro 7 14 Intel (Intel Graphics) | Lenovo ThinkPad P14s Gen 7 (RTX PRO 1000) |
|---|---|---|---|---|
| CPU Single-Core | 2,609 | 2,527 | 2,589 | 2,533 |
| CPU Multi-Core | 17,878 | 17,345 | 17,805 | 17,651 |
| GPU OpenCL | 23,849 | 23,737 | 23,876 | 75,340 |
| GPU Vulkan | 23,451 | 23,036 | 23,484 | 70,067 |
Here, the Premium leads all three comparison systems on both CPU measures, at 2,609 single-core and 17,878 multi-core. The margins over the identical 366H in the EliteBook (2,527 / 17,345) and the Pro 7 14 (2,589 / 17,805) are small but consistent, and they came out of the lightest chassis in the group. The GPU results repeat the 4 Xe cluster, with the three iGPU systems separated by less than 2%.
Cinebench 2026
Cinebench 2026 uses Maxon’s Redshift engine to render a production scene on the CPU; the GPU test requires more graphics memory than these integrated platforms allocate, so it runs only on the discrete-GPU comp.
| Cinebench 2026 (higher is better) | Dell Pro 14 Premium | HP EliteBook X G2i | Dell Pro 7 14 Intel | Lenovo ThinkPad P14s Gen 7 |
|---|---|---|---|---|
| CPU Single Thread | 508 | 494 | 511 | 502 |
| CPU Multiple Threads | 3,857 | 4,060 | 3,807 | 4,492 |
| GPU | N/A | N/A | N/A | 34,437 |
Single-thread lands at 508, splitting the 366H group between the Pro 7 14’s 511 and the HP’s 494. Multi-thread at 3,857 edges the Pro 7 14 but trails the EliteBook’s 4,060, the one CPU test where HP’s thermal tuning pulls ahead of this chassis, and the P14s clears everyone at 4,492 with more cooling mass to spend.
3DMark CPU Profile
3DMark CPU Profile scales the same workload from a single thread to the maximum available, showing how performance scales as threads are added.
| 3DMark CPU Profile (higher is better) | Dell Pro 14 Premium | HP EliteBook X G2i | Dell Pro 7 14 Intel | Lenovo ThinkPad P14s Gen 7 |
|---|---|---|---|---|
| Max Threads | 9,625 | 9,179 | 9,699 | 10,500 |
| 16 Threads | 9,321 | 8,995 | 9,679 | 10,421 |
| 8 Threads | 5,857 | 5,814 | 6,450 | 6,550 |
| 4 Threads | 3,892 | 3,812 | 4,240 | 4,219 |
| 2 Threads | 2,143 | 2,095 | 2,230 | 2,251 |
| 1 Thread | 1,147 | 1,108 | 1,163 | 1,165 |
The full curve is tight against the other 366H machines: within 5% of the Pro 7 14 at every step and ahead of the EliteBook from 2 threads up, with a Max Threads score of 9,625. The P14s holds roughly a 9% lead at the top of the curve, consistent with its heavier thermal envelope.
7-Zip Compression
7-Zip’s built-in benchmark measures compression and decompression throughput in GIPS across all cores.
| 7-Zip 24.09 (GIPS, higher is better) | Dell Pro 14 Premium | HP EliteBook X G2i | Dell Pro 7 14 Intel | Lenovo ThinkPad P14s Gen 7 |
|---|---|---|---|---|
| Compressing | 86.300 | 89.259 | 83.281 | 90.364 |
| Decompressing | 79.533 | 86.189 | 76.774 | 90.526 |
| Total Rating | 82.916 | 87.724 | 81.2 | 90.445 |
The Premium’s 82.916 GIPS total rating sits between the Pro 7 14’s 81.2 and the EliteBook’s 87.724, with the P14s on top at 90.445. Decompression is the weaker half of the run at 79.533 GIPS; compression at 86.300 is within 4% of the group leaders.
y-cruncher
y-cruncher computes Pi to a fixed number of digits, stressing memory bandwidth in the standard runs and pure CPU throughput in the BBP runs.
| y-cruncher (seconds, lower is better) | Dell Pro 14 Premium | HP EliteBook X G2i | Dell Pro 7 14 Intel | Lenovo ThinkPad P14s Gen 7 |
|---|---|---|---|---|
| Pi 1B | 34.930 | 34.920 | 34.775 | 26.685 |
| Pi 2.5B | 102.429 | 97.527 | 104.586 | 76.787 |
| Pi 5B | 227.217 | N/A | 240.554 | 172.994 |
| Pi BBP 1B | 1.905 | 1.842 | 1.835 | 1.621 |
| Pi BBP 10B | 23.152 | 22.451 | 21.280 | 18.200 |
| Pi BBP 100B | 292.475 | 269.011 | 301.611 | 219.969 |
The Premium completed the 5-billion-digit run at 227.2 seconds, a run the 32GB EliteBook could not attempt, and beat the Pro 7 14’s 240.6 seconds while trailing the P14s across the board. The BBP results track the same order. One note on the largest run: the 10B standard test was skipped due to insufficient available memory at test time despite the 64GB fit-out; the Pro 7 14 completed it on the same memory configuration.
Blender
Blender 5.2’s benchmark renders the Monster, Junkshop, and Classroom scenes on both GPU and CPU, with scores in samples per minute.
| Blender 5.2 (samples/min, higher is better) | Dell Pro 14 Premium (Intel Graphics) | HP EliteBook X G2i (Intel Graphics) | Dell Pro 7 14 Intel (Intel Graphics) | Lenovo ThinkPad P14s Gen 7 (RTX PRO 1000) |
|---|---|---|---|---|
| GPU | ||||
| Monster | 236.31 | 250.14 | 254.40 | 922.95 |
| Junkshop | 181.84 | 154.95 | 189.59 | 795.65 |
| Classroom | 149.74 | 149.90 | 152.73 | 625.62 |
| CPU | ||||
| Monster | 110.11 | 118.87 | 107.87 | 131.08 |
| Junkshop | 77.31 | 84.95 | 78.06 | 97.76 |
| Classroom | 52.17 | 57.45 | 53.90 | 68.45 |
GPU rendering is a wash across the 4 Xe systems; the Premium’s 236.31 on Monster trails the Pro 7 14 by about 7%, while its 181.84 on Junkshop leads the EliteBook by 17%, which is trading places within the same thermal band. The CPU runs end up a few percent behind the EliteBook. None of these are rendering machines, and the P14s column shows the gap a workstation GPU opens: roughly 4x on every GPU scene.
LuxMark
LuxMark v4 renders the Hall Bench and Food scenes with the OpenCL-based LuxCoreRender engine.
| LuxMark v4 (higher is better) | Dell Pro 14 Premium | HP EliteBook X G2i | Dell Pro 7 14 Intel | Lenovo ThinkPad P14s Gen 7 |
|---|---|---|---|---|
| Hall | 2,577 | 2,481 | 2,168 | 11,342 |
| Food | 1,094 | 1,058 | 880 | 4,103 |
At 2,577 on Hall and 1,094 on Food, the Premium posts the best iGPU numbers in the group, about 4% ahead of the EliteBook and 19- 24% ahead of the Pro 7 14. That is the clearest case in the suite of this chassis sustaining iGPU clocks better than the volume Dell.
V-Ray
V-Ray’s GPU benchmark measures path-traced rendering throughput in vpaths.
| V-Ray GPU (vpaths, higher is better) | Dell Pro 14 Premium | HP EliteBook X G2i | Dell Pro 7 14 Intel | Lenovo ThinkPad P14s Gen 7 |
|---|---|---|---|---|
| CUDA Engine | 793 | 850 | 775 | 1,568 |
| RTX Engine | N/A | N/A | N/A | 2,589 |
The 793 vpaths result splits its two 366H comps, ahead of the Pro 7 14’s 775 and behind the EliteBook’s 850. The RTX engine row belongs to the P14s alone; nothing integrated runs it.
Blackmagic RAW Speed Test
Blackmagic RAW Speed Test measures 8K BRAW 12:1 decode throughput on CPU and GPU, a practical proxy for editing timeline scrubbing.
| Blackmagic RAW Speed Test (fps, higher is better) | Dell Pro 14 Premium | HP EliteBook X G2i | Dell Pro 7 14 Intel | Lenovo ThinkPad P14s Gen 7 |
|---|---|---|---|---|
| 8K 12:1 CPU | 68 | 72 | 68 | 77 |
| 8K 12:1 GPU | 48 | 48 | 48 | 96 |
CPU decode at 68 fps and GPU decode at 48 fps match the Pro 7 14 exactly and sit within 6% of the EliteBook. Every 4 Xe system converges on 48 fps for GPU decode; the P14s doubles it.
Topaz Video AI
Topaz Video AI runs its built-in benchmark at 1080p input across upscaling, denoising, frame interpolation, and slow-motion models.
| Topaz Video AI (fps, higher is better) | Dell Pro 14 Premium | HP EliteBook X G2i | Dell Pro 7 14 Intel | Lenovo ThinkPad P14s Gen 7 (RTX PRO 1000) |
|---|---|---|---|---|
| Artemis 1X / 2X / 4X | 2.57 / 2.62 / 0.99 | 2.45 / 2.48 / 0.91 | 2.51 / 2.53 / 0.95 | 5.17 / 3.19 / 1.12 |
| Iris 1X / 2X / 4X | 2.44 / 1.41 / 0.43 | 2.44 / 1.40 / 0.43 | 2.38 / 1.37 / 0.42 | 5.91 / 3.12 / 1.01 |
| Proteus 1X / 2X / 4X | 2.60 / 2.84 / 1.10 | 2.59 / 2.86 / 1.11 | 2.52 / 2.76 / 1.06 | 4.78 / 3.14 / 1.05 |
| Gaia 1X / 2X / 4X | 1.36 / 0.92 / 0.70 | 1.34 / 0.91 / 0.69 | 1.31 / 0.89 / 0.67 | 1.62 / 1.13 / 0.79 |
| Nyx 1X / 2X | 0.73 / 0.73 | 0.72 / 0.72 | 0.71 / 0.71 | 2.40 / 2.09 |
| Hyperion HDR 1X | 2.15 | 2.08 | 2.02 | 14.56 |
| 4X Slowmo Apollo / APFast | 4.61 / 16.14 | 4.61 / 16.06 | 3.08 / 14.64 | 10.39 / 29.94 |
| 16X Slowmo Aion | DNF | DNF | DNF | N/A |
The three 366H systems are functionally interchangeable here, with the Premium a few hundredths ahead on most rows, including Gaia 4X at 0.70 fps. The 16X Slowmo Aion model failed to complete on this unit, as it has on every integrated-graphics system in this stack. These workloads require the P14s-class of hardware or better; the iGPU numbers are for completeness.
UL Procyon AI Text Generation
Procyon AI Text Generation runs four local LLMs (Phi, Mistral, Llama3, Llama2) and scores generation performance. Across all four machines, we are running the same CPU model, as shown in our results. For the most part, we see pretty close results, with the EliteBook X G2i possibly taking a thermal hit compared to the larger models.
| Procyon AI Text Generation (higher is better) | Dell Pro 14 Premium | HP EliteBook X G2i | Dell Pro 7 14 Intel | Lenovo ThinkPad P14s Gen 7 (IGPU / RTX PRO 1000) |
|---|---|---|---|---|
| Phi | 1,121 | 1,082 | 1027 | 1071 / 1,618 |
| Mistral | 1,111 | 1,053 | 1027 | 1058 / 1,397 |
| Llama3 | 1,099 | 952 | 1014 | 1047 / 1,252 |
| Llama2 | 1,053 | 993 | 1009 | 1012 / DNF |
In this test, the Premium leads all three competitors on all four models. On the pro 7 14, 1,121 against 1,027 on Phi and 1,099 against 1,014 on Llama3. We also ran the suite on the 50 TOPS NPU, which scored 831 / 717 / 697 / 593 across the four models. That is slower than the iGPU path, but it comes at a fraction of the power draw, the trade-off Copilot+ workloads are designed to make.
UL Procyon AI Image Generation
Procyon AI Image Generation measures Stable Diffusion throughput; SD 1.5 runs at FP16 and INT8 precision, with an additional INT8 run on the NPU, plus the heavier SDXL FP16 workload.
| Procyon AI Image Generation (higher is better) | Dell Pro 14 Premium | HP EliteBook X G2i | Dell Pro 7 14 Intel | Lenovo ThinkPad P14s Gen 7 (RTX PRO 1000) |
|---|---|---|---|---|
| SD 1.5 FP16 | 253 | 258 | 258 | 943 |
| SD 1.5 INT8 | 3,604 | 3,529 | 3,575 | 12,403 |
| SD 1.5 INT8 (NPU) | 2,888 | N/A | N/A | N/A |
| SDXL FP16 | DNF | 307 | 268 | 765 |
SD 1.5 results are engine-matched (OpenVINO) across the three iGPU systems and effectively tied: 253 at FP16 and 3,604 at INT8, the latter a hair ahead of both comps. The NPU INT8 run scored 2,888, about 80% of iGPU throughput. SDXL FP16 is the outlier: the run crashed the system twice, and we skipped it per lab policy, a workload the EliteBook completed at 307 on identical silicon. Either way, the practical takeaway is that SDXL-class model loads are where this iGPU tier runs out of road.
UL Procyon AI Computer Vision
Procyon AI Computer Vision runs six inference models under WinML, giving a CPU and GPU view of traditional vision workloads.
| Procyon AI Computer Vision (WinML, higher is better) | Dell Pro 14 Premium | HP EliteBook X G2i | Dell Pro 7 14 Intel | Lenovo ThinkPad P14s Gen 7 |
|---|---|---|---|---|
| CPU | 120 | 126 | 121 | 134 |
| GPU | 213 | 205 | 205 | 426 |
Here we can see a little bit of variance, but the Pro 14 Premium, EliteBook X G2i, and Pro 7 14 all stayed pretty close together, with the biggest gap in the GPU test on the P14s Gen 7. Other than that, the Pro 14 Premium took a slight lead in the GPU test until it met the P14s Gen7.
SPECviewperf 15
SPECviewperf 15 measures professional visualization viewsets from 3ds Max, Blender, CATIA, Creo, Maya, Siemens NX, SolidWorks, and others, run here at FHD.
| SPECviewperf 15 (FHD, higher is better) | Dell Pro 14 Premium | HP EliteBook X G2i | Dell Pro 7 14 Intel | Lenovo ThinkPad P14s Gen 7 (RTX PRO 1000) |
|---|---|---|---|---|
| 3dsmax-08 | 9.41 | 8.70 | 9.58 | 28.20 |
| blender-01 | 9.23 | 9.26 | 9.11 | 40.69 |
| catia-07 | 5.46 | 5.66 | 5.27 | 43.36 |
| creo-04 | 18.49 | 18.85 | 18.27 | 107.59 |
| energy-04 | 3.60 | 3.62 | 3.68 | 45.79 |
| enscape-01 | 6.20 | 6.29 | 6.22 | 25.45 |
| maya-07 | 48.77 | 52.56 | 49.54 | 112.84 |
| medical-04 | 9.79 | 9.97 | 9.91 | 86.38 |
| snx-05 | 37.99 | 37.45 | 37.74 | 103.61 |
| solidworks-08 | 11.77 | 12.37 | 11.86 | 53.63 |
| unreal_engine-01 | 21.81 | 21.47 | 21.36 | 49.24 |
All eleven viewsets produced scores, and the three 366H systems land within a few percent of one another on nearly every one; maya-07 at 48.77 and snx-05 at 37.99 are representative. Nobody should buy any of these three for viewport work, and the P14s column, 2.5x to 8x ahead, is the quantified argument for stepping up to certified workstation graphics.
SPECworkstation 4
SPECworkstation 4 aggregates real application workloads into hardware subsystem scores and industry vertical scores.
| SPECworkstation 4 (SPEC ratio, higher is better) | Dell Pro 14 Premium | HP EliteBook X G2i | Dell Pro 7 14 Intel | Lenovo ThinkPad P14s Gen 7 |
|---|---|---|---|---|
| Hardware Subsystems | ||||
| CPU | 1.15 | 1.16 | 1.08 | 1.35 |
| Graphics | 0.82 | 0.80 | 0.82 | 4.51 |
| Accelerator | N/A | 1.46 | N/A | 3.26 |
| Storage | 0.96 | 1.65 | 1.68 | 1.67 |
| Industry Verticals | ||||
| AI & Machine Learning | 1.15 | 1.16 | 1.18 | 1.65 |
| Energy | 0.91 | 1.02 | 0.90 | 1.69 |
| Financial Services | 0.77 | 0.79 | 0.78 | 0.96 |
| Life Sciences | 1.17 | 1.14 | 1.04 | 1.82 |
| Media & Entertainment | DNF | 1.24 | 1.16 | 1.81 |
| Product Design | 1.29 | 1.47 | 1.41 | 1.89 |
| Productivity & Development | 0.86 | 0.93 | 1.04 | 1.34 |
CPU at 1.15 matches the EliteBook and leads the Pro 7 14; Graphics at 0.82 is the familiar 4 Xe result. The Storage subsystem is the outlier at 0.96, compared to 1.65- 1.6868 for every comp, and it is a real hardware difference that we detail in the next section. The Media & Entertainment vertical did not produce a score because the HandBrake workload failed to complete; 22 of 23 workloads were scored.
Storage Performance
We look at storage with 3DMark’s Storage Benchmark and the Blackmagic Disk Speed Test.
| Storage | Dell Pro 14 Premium | HP EliteBook X G2i | Dell Pro 7 14 Intel | Lenovo ThinkPad P14s Gen 7 |
|---|---|---|---|---|
| 3DMark Storage | 1,913 | 3,156 | 3,259 | 3,094 |
| Blackmagic Write (MB/s) | 4,574.1 | 8,949.2 | 8,934.5 | 8,262.3 |
| Blackmagic Read (MB/s) | 4,954.5 | 7,919.3 | 8,398.6 | 8,511.5 |
This is the clearest cost-saving in the build. The 1TB Samsung PM9C1b is a Gen4 value drive, and it shows: 4,954.5 MB/s reads and 4,574.1 MB/s writes against roughly 8,000-8,900 MB/s for the Gen5 drives in all three comparison systems, with a 3DMark Storage score of 1,913 against their 3,094- 3,259. For the office and collaboration workloads this machine targets, the difference rarely surfaces in feel, but a flagship config shipping the slowest drive in its comp set is worth knowing about, and SPECworkstation’s storage subsystem score above says the same thing. Most users will want to configure this system with a Gen5 SSD to take full advantage.
Conclusion
The Pro 14 Premium is the best build Dell makes of its lightest commercial laptop, and the configuration mostly delivers on that framing. The 366H posts the strongest Geekbench 7 CPU numbers of any system we have tested on this silicon. LuxMark indicates the chassis sustains iGPU clocks better than the Pro 7 14, and it does so at around 2.5 pounds with a Tandem OLED panel, vPro Enterprise, and a customer-replaceable battery. Sixteen and a half hours of tested battery life covers the mobility brief even with the premium panel; buyers who value runtime over the panel can spec the WUXGA LCD and aim for the Pro 7 14’s 26-hour class instead.

The trade-offs are the graphics ceiling and the SSD. The 4 Xe iGPU is the top graphics option across the entire line, so there is no upsell path for anyone whose workload touches rendering, viewports, or heavier local AI image generation; that buyer moves to a mobile workstation. And the Gen4 PM9C1b is a conspicuous decision, with the system at $5,219 as tested, at roughly half the throughput of every drive in its comp set. Most buyers should opt for the Gen5 part instead.
Though it may not feel as solid as an aluminum shell, the magnesium chassis still offers good durability while shaving off a few ounces for portability. The display shows a little reflection from a nearby light fixture, but the image quality of the Tandem OLED panel makes up for it. Though it may not be for graphic design or CAD workloads, the Pro 14 Premium makes a great office workhorse for on-the-go work, running between meetings, or even toting it home thanks to its lightweight, low-profile chassis.
The Dell Pro 14 Premium now sits at #11 on our Laptop Battery Life Leaderboard with its 16 hour 30 minute result, and appears in our Best Business Laptops coverage.


 Amazon