

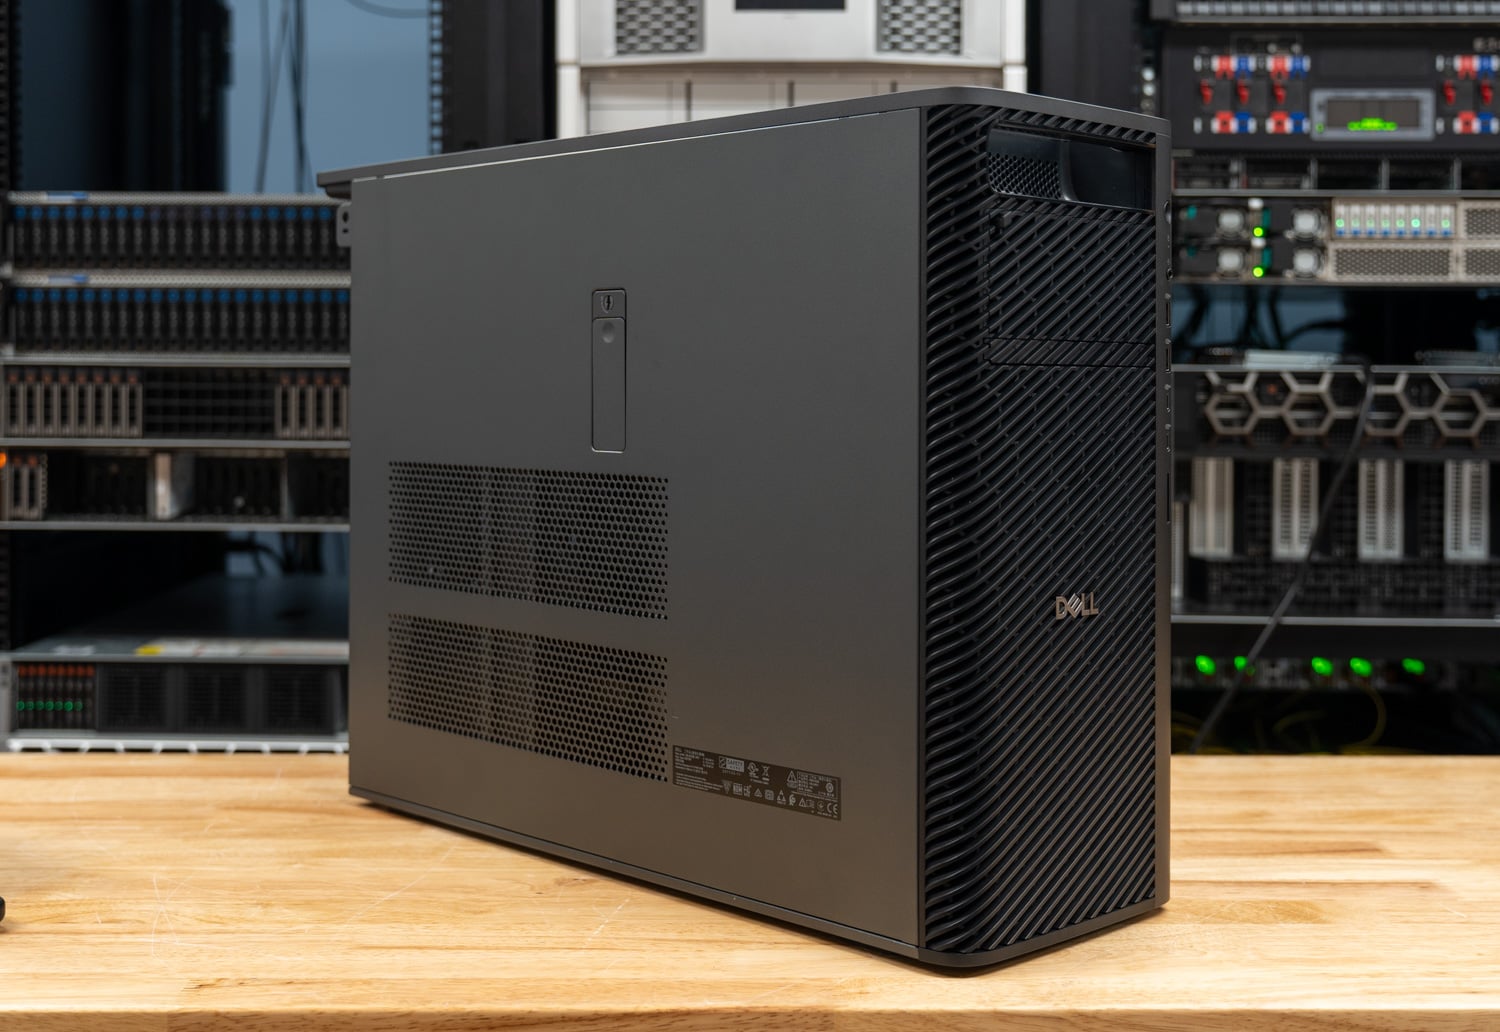
The Dell Pro Precision 9 T4 is the single-socket tower at the top of Dell’s Pro Precision line, and our review unit is configured for local AI at a scale most workstations can’t reach. It pairs Intel’s 86-core Xeon 698X with 256GB of DDR5-6400 ECC memory, two 300W NVIDIA RTX PRO 6000 Blackwell Max-Q cards with 96GB of GDDR7 each, two 2TB Gen5 SSDs, and a dual-port 25GbE adapter, powered by a 2400W supply. Configured the same way on Dell.com, it lists at about $66,600.
Key Takeaways
- Two GPUs turn a model that does not fit on one card into a usable one. MiniMax M2.7 at 129.3GB generated 83.7 tokens per second for one user when split across both RTX PRO 6000 cards, 2.8 times the 30.3 tokens per second with one card and the rest of the model in system memory.
- The second GPU scaled serving by 1.85 to 2.02 times and embedding by 1.92 times. Peak llama.cpp output rose from 582.5 to 1,176.1 tokens per second on Ministral 3 3B and from 424.8 to 787.9 on gpt-oss 120B with one server per GPU, and embedding one million Wikipedia passages dropped from 890 to 464 seconds.
- A second GPU cut a LoRA epoch by 37 percent. One epoch of LoRA on Ministral 3 8B took 31.5 minutes on one GPU and 19.7 minutes on two, ending at held-out losses of 1.169 and 1.167.
- Memory bandwidth is where the T4’s Xeon pulls ahead. STREAM Triad reached 328GB/s, 53 percent above the Threadripper PRO 9995WX in the Precision 7875, and the T4 finished the OpenFOAM drivAer solve in 293 seconds against 556 and a 10-billion-digit y-cruncher run in 53.9 seconds against 83.7.
- The Precision 7875 leads on core-bound CPU work. The 96-core Threadripper ran 37 percent ahead in 7-Zip and 30 percent ahead in Blender Monster, and it finished the LLVM build in 43.7 seconds against 58.4.
Where the Pro Precision 9 T4 Sits
Dell positions the T4 as its flagship single-socket tower workstation for organizations that need maximum compute density and expandability, with AI development, engineering simulation, and scientific computing at the top of its workload list. It sits above the Dell Pro Precision 9 T2, which uses the same Granite Rapids-WS Xeon 6 workstation platform in a smaller chassis with one GPU. The T4 adds the eight-channel processors at the top of the range, up to 86 cores, and room for up to four graphics cards, depending on the model.
Processor options on Dell.com start at the 12-core Xeon 634 and run through the 64-core Xeon 696X to the 86-core Xeon 698X in our unit, which carries 336MB of cache, a 2.0GHz base clock, a 4.8GHz maximum, and a 350W rating. Memory goes up to 4TB of DDR5 RDIMM across 16 slots, and our unit fills eight of them with 32GB modules at 6400MT/s. Graphics start at a single RTX A400, and the card count depends on the model: Dell’s configurator lists four RTX A1000 cards, three RTX PRO 4000 Blackwell cards, two 300W RTX PRO 6000 Max-Q cards, or one 600W RTX PRO 6000.
The base configuration is listed at $5,925 on Dell.com. Our configuration adds $8,300 for the Xeon 698X, $15,000 for the 256GB of memory, and $30,820 for the pair of RTX PRO 6000 Max-Q cards before storage, networking, and the 36-month ProSupport upgrade that Dell adds automatically to a build at this level.
Build and Design
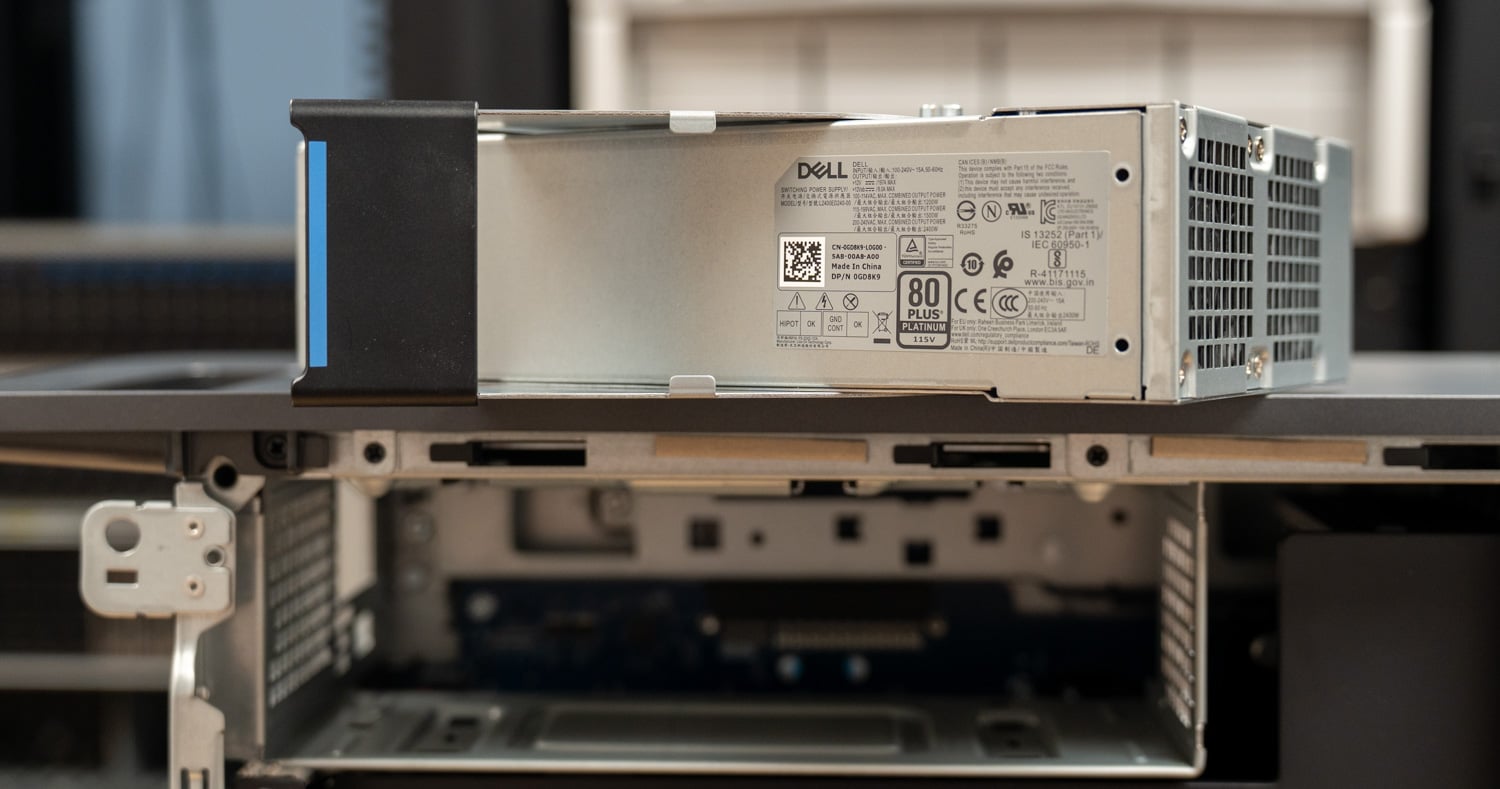
The T4 is a full tower at 449.8mm tall, 203.7mm wide, and 617.5mm deep, and Dell lists it at 24.1kg minimum and 33.6kg maximum depending on configuration. Our unit uses the 2400W Platinum power supply, which Dell’s configurator selects for the dual RTX PRO 6000 configuration, and a 1500W supply is the default on lighter builds.
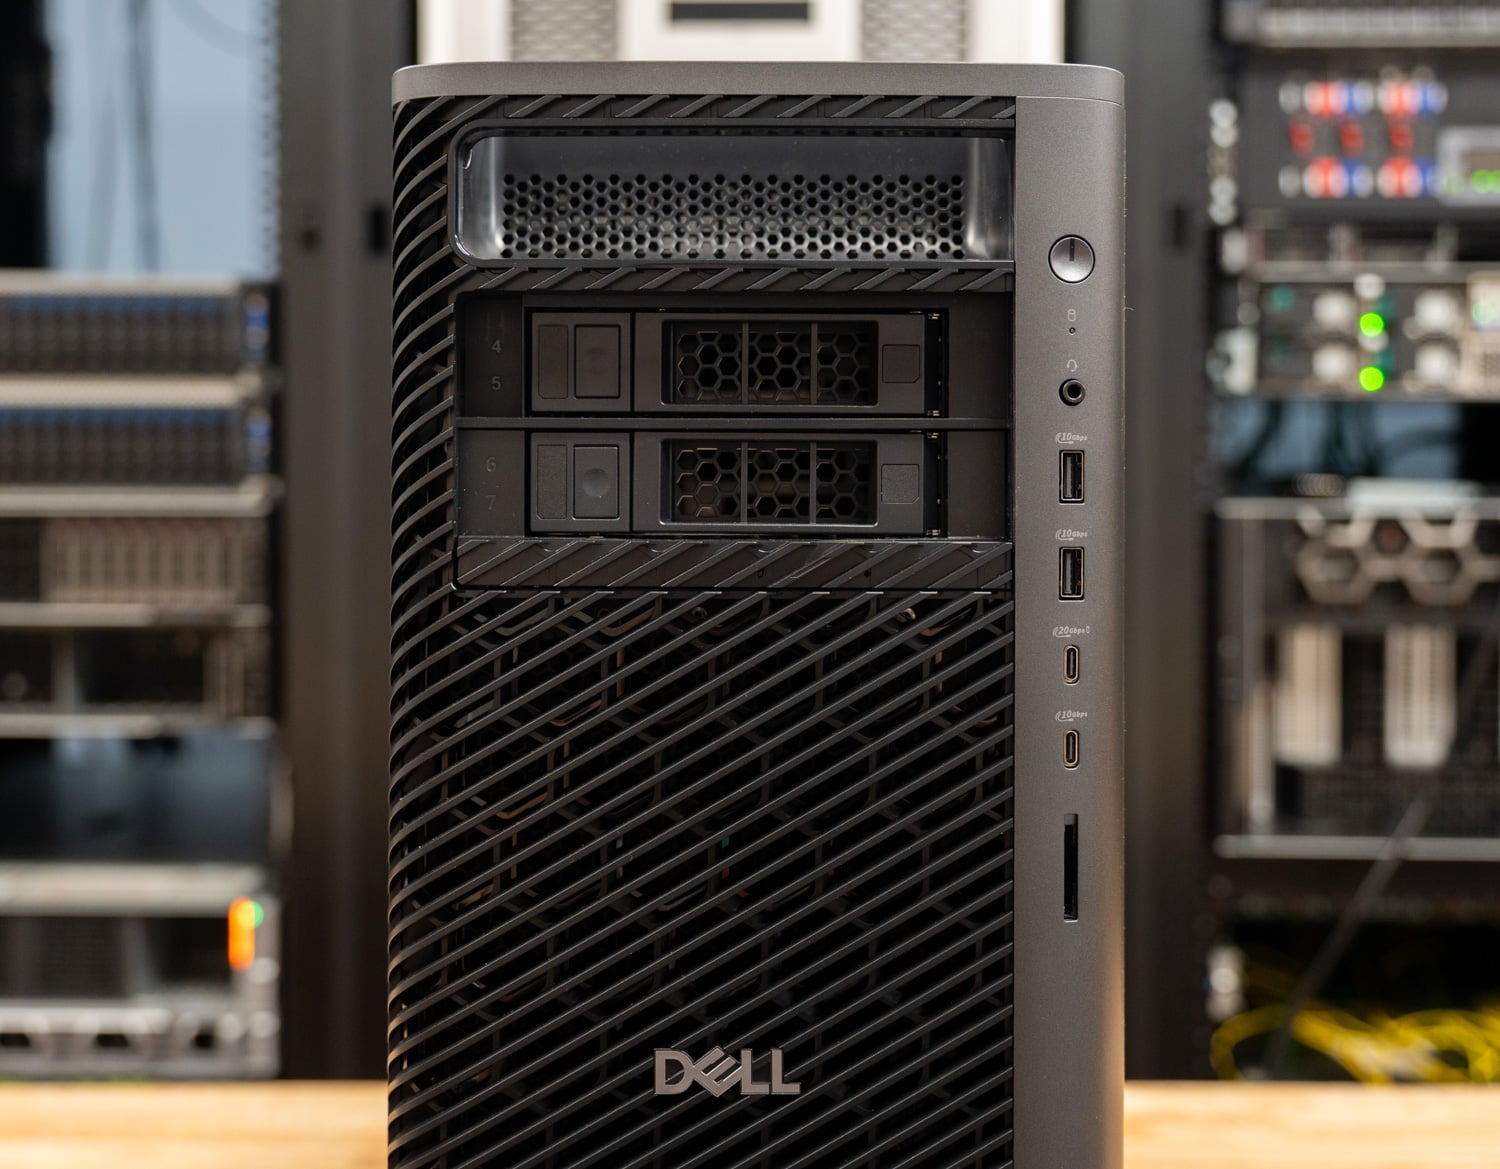
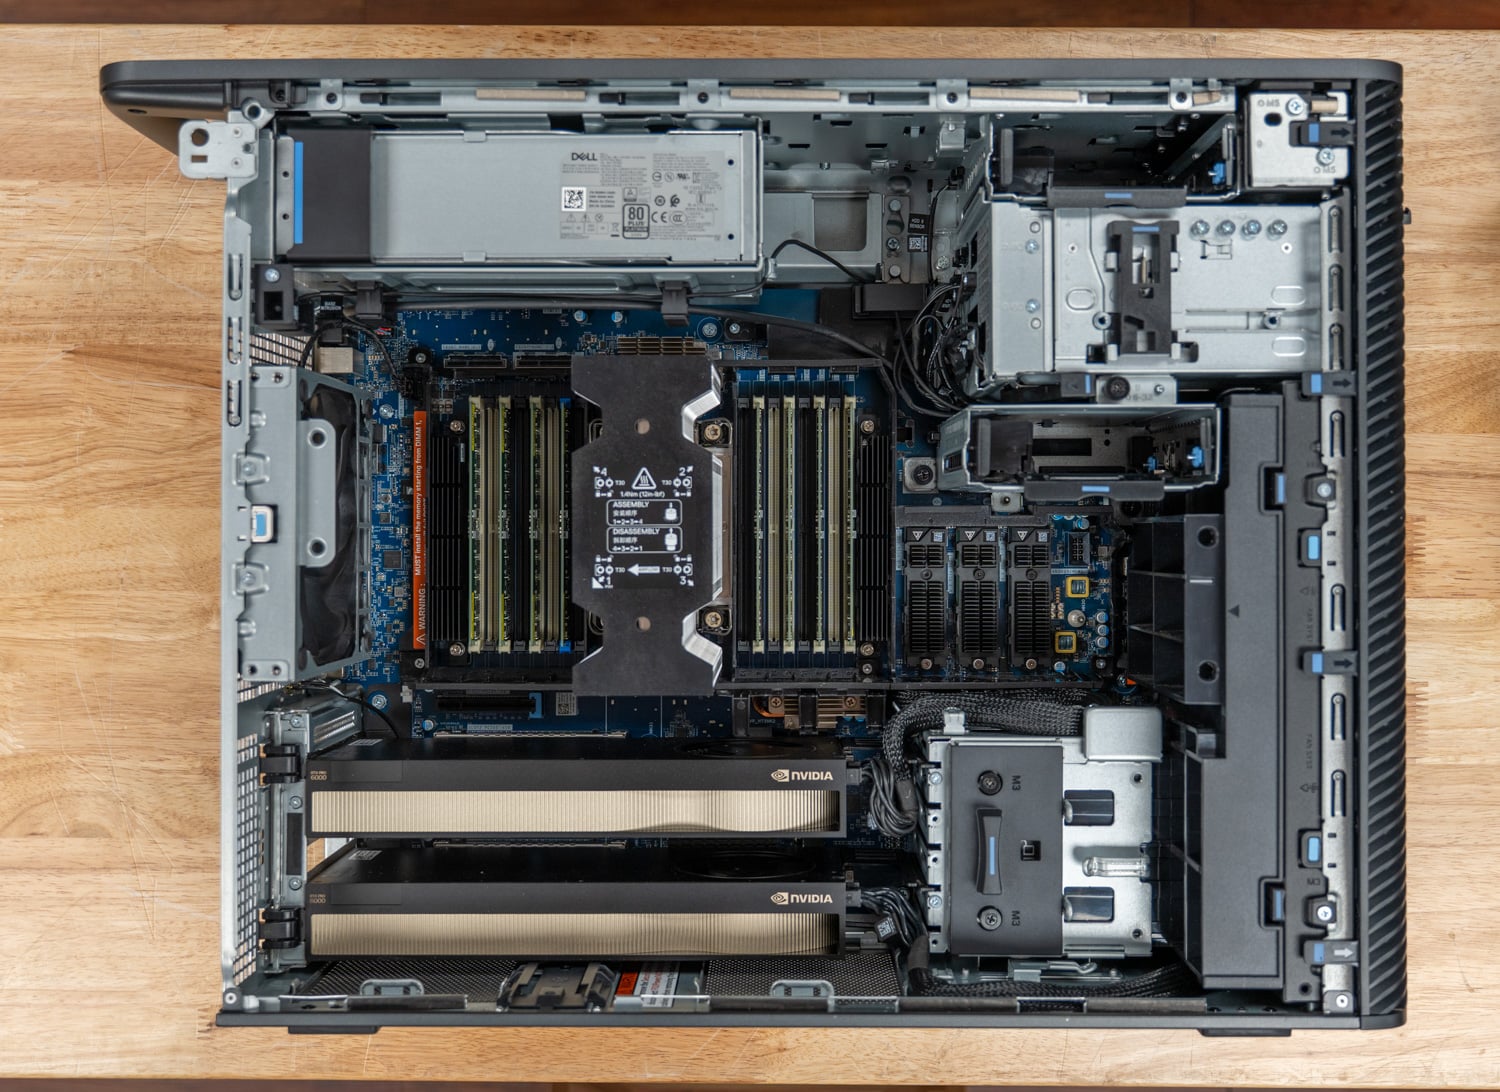
Serviceability is a strong point of the T4, starting with tool-less entry through a latch on the side panel and a 2400W power supply that slides out of the top rear of the chassis by hand. Everything else, including the graphics cards and the SSDs, comes out with a Phillips screwdriver, and Dell’s blue touch points mark the parts that come out by hand. The lab found the platform easy for a user to repair in the field, which matters for a workstation at this price.
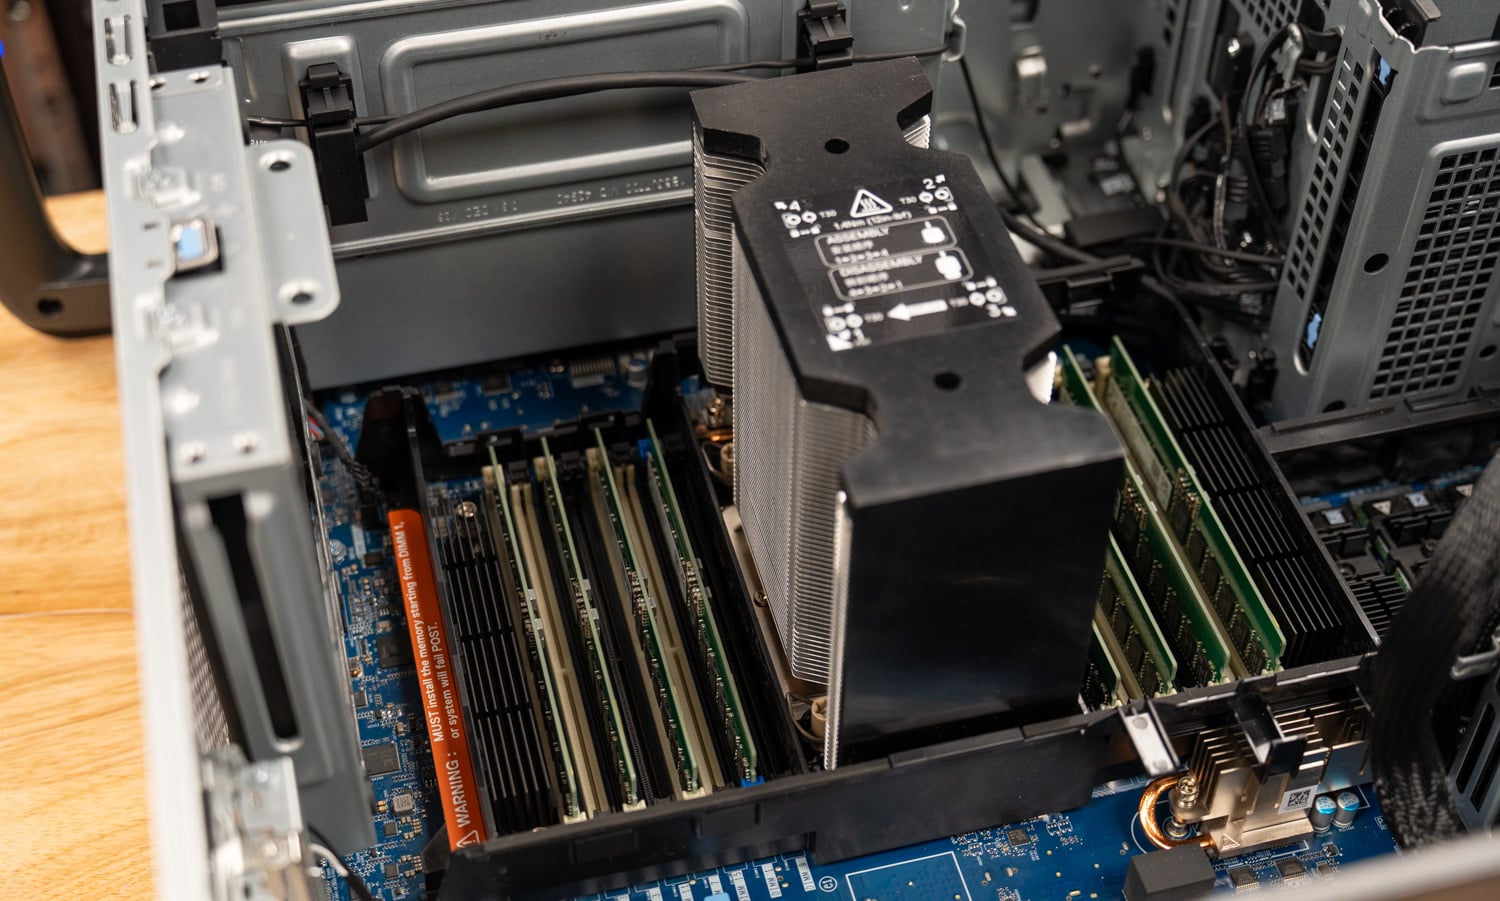
Cooling is the best execution we have seen from Dell in this class of tower. Air moves front to back, and large form-fitted cowls drive it down and across the processor and the memory while keeping that channel separate from the PCIe area. The two 300W graphics cards therefore pull from a separate stream of air and do not inherit heat from the 350W Xeon. With the cowls in place, two fans sit between the processor zone and the card bay, and the assembly carries the same blue touch points and lifts out for access to the memory.
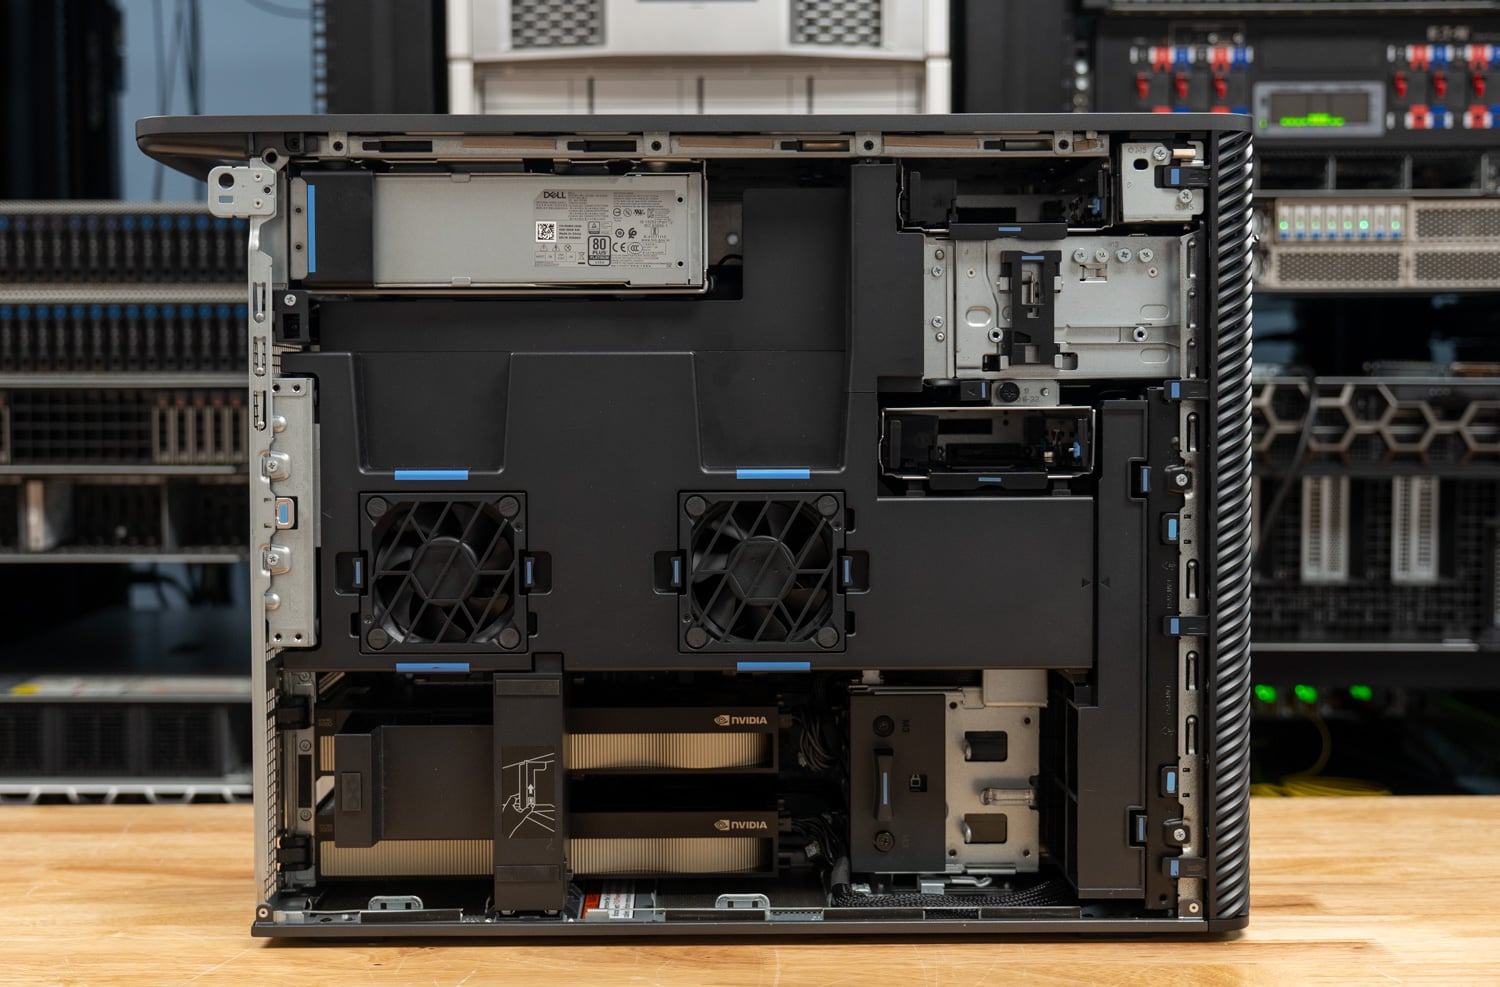
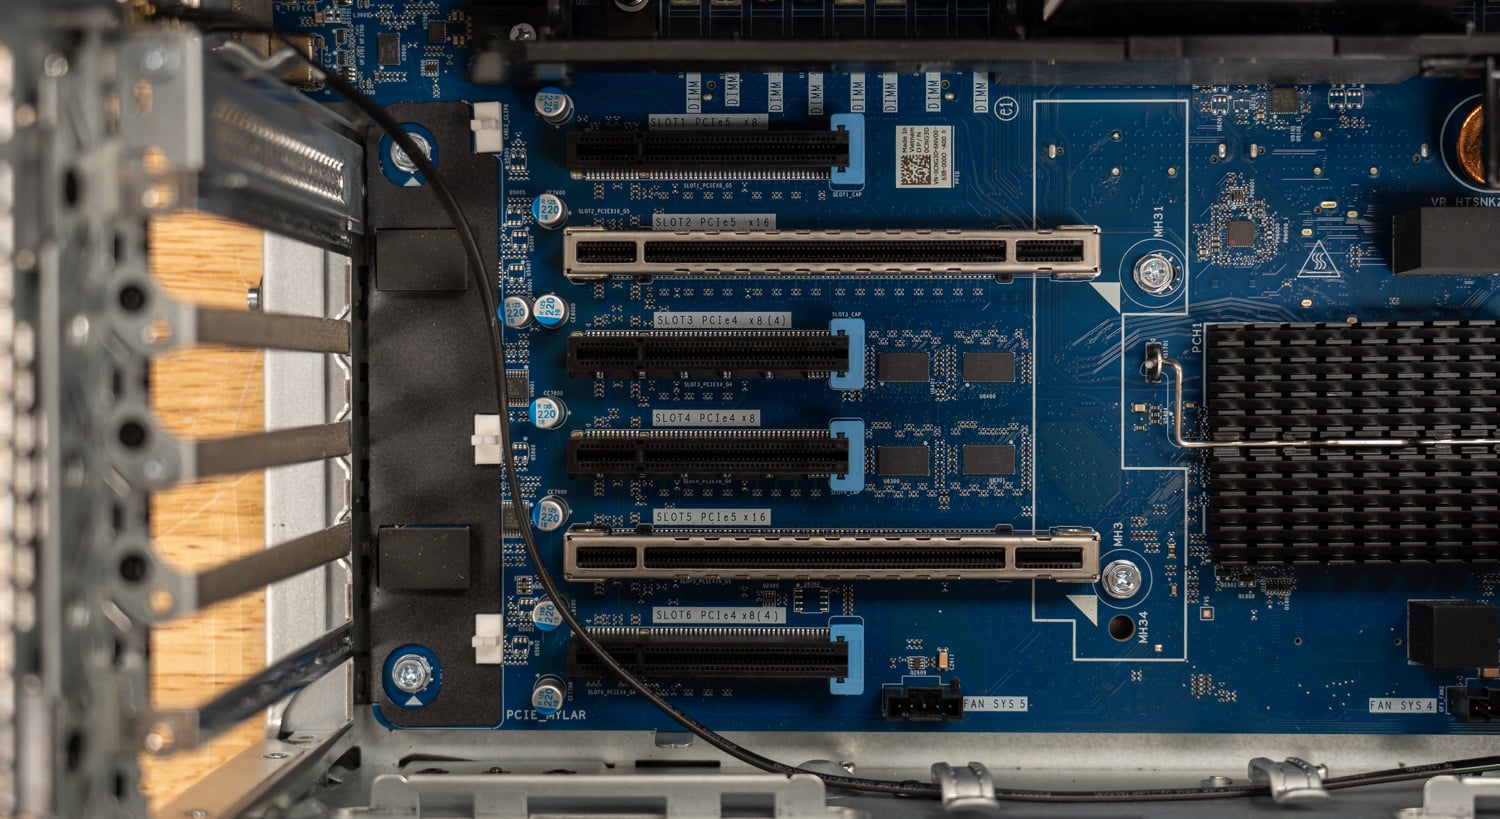
Expansion runs through six full-height PCIe slots: two Gen5 x16 slots that carry the GPUs, a Gen5 x8, a Gen4 x8, and two Gen4 slots with x8 connectors and x4 wiring. Storage covers three internal M.2 Gen5 slots and one Gen4 slot, two internal 3.5-inch SATA bays, and a front FlexBay that holds up to four NVMe drives or two 3.5-inch drives, with an optional slim optical drive. Our unit boots from an internal 2TB Gen5 drive and carries another 2TB Gen5 drive in an internal M.2 slot.
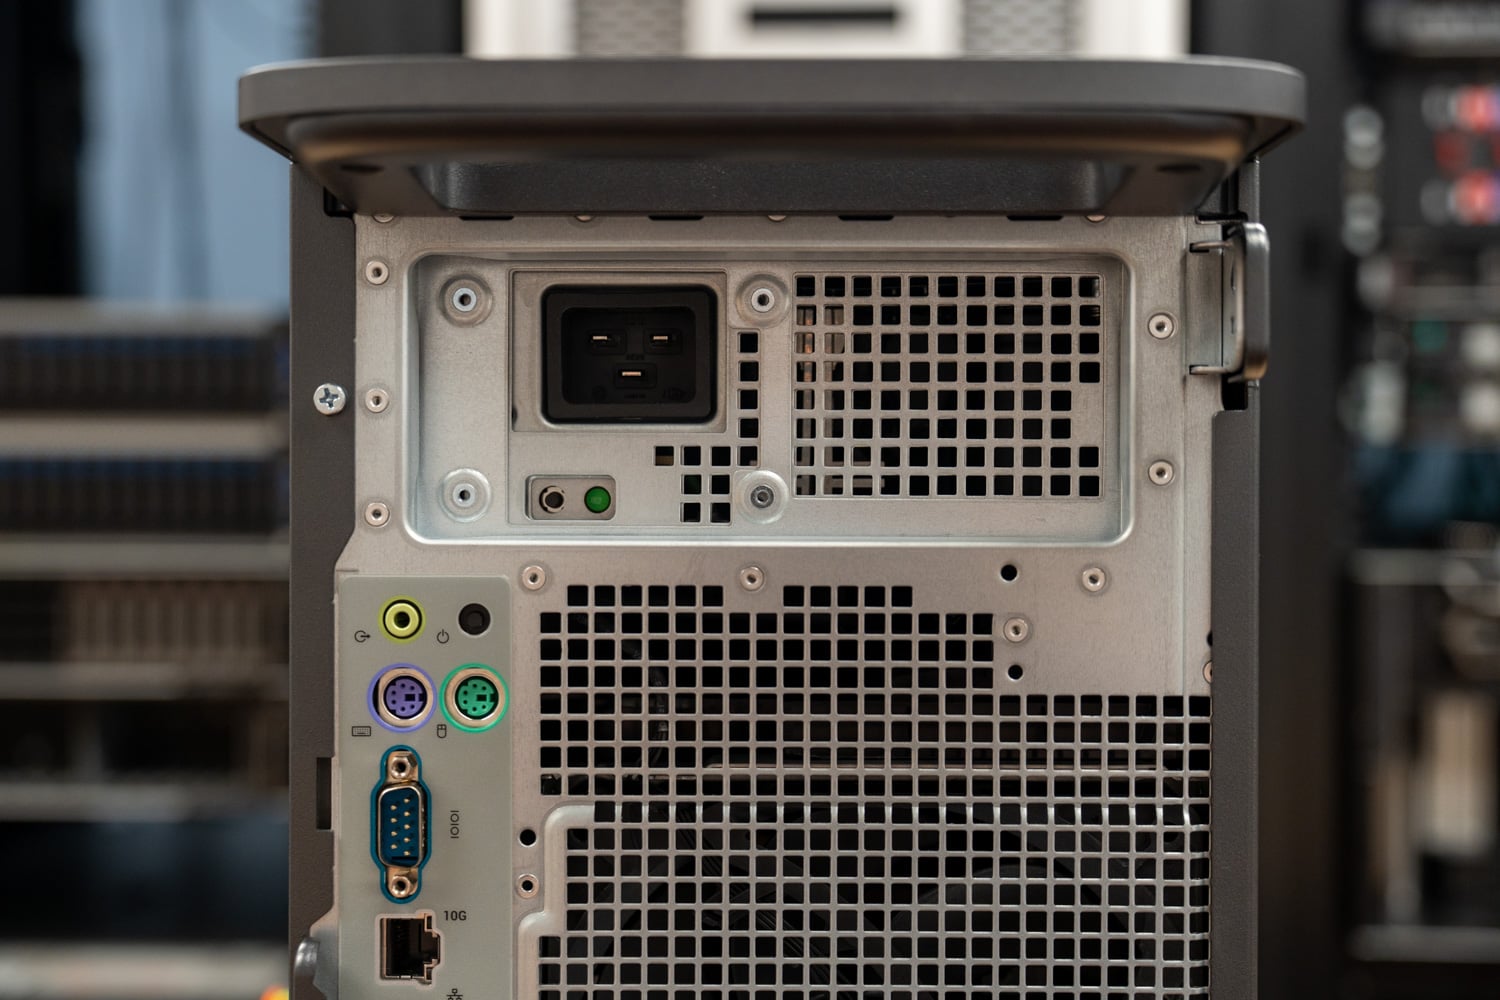
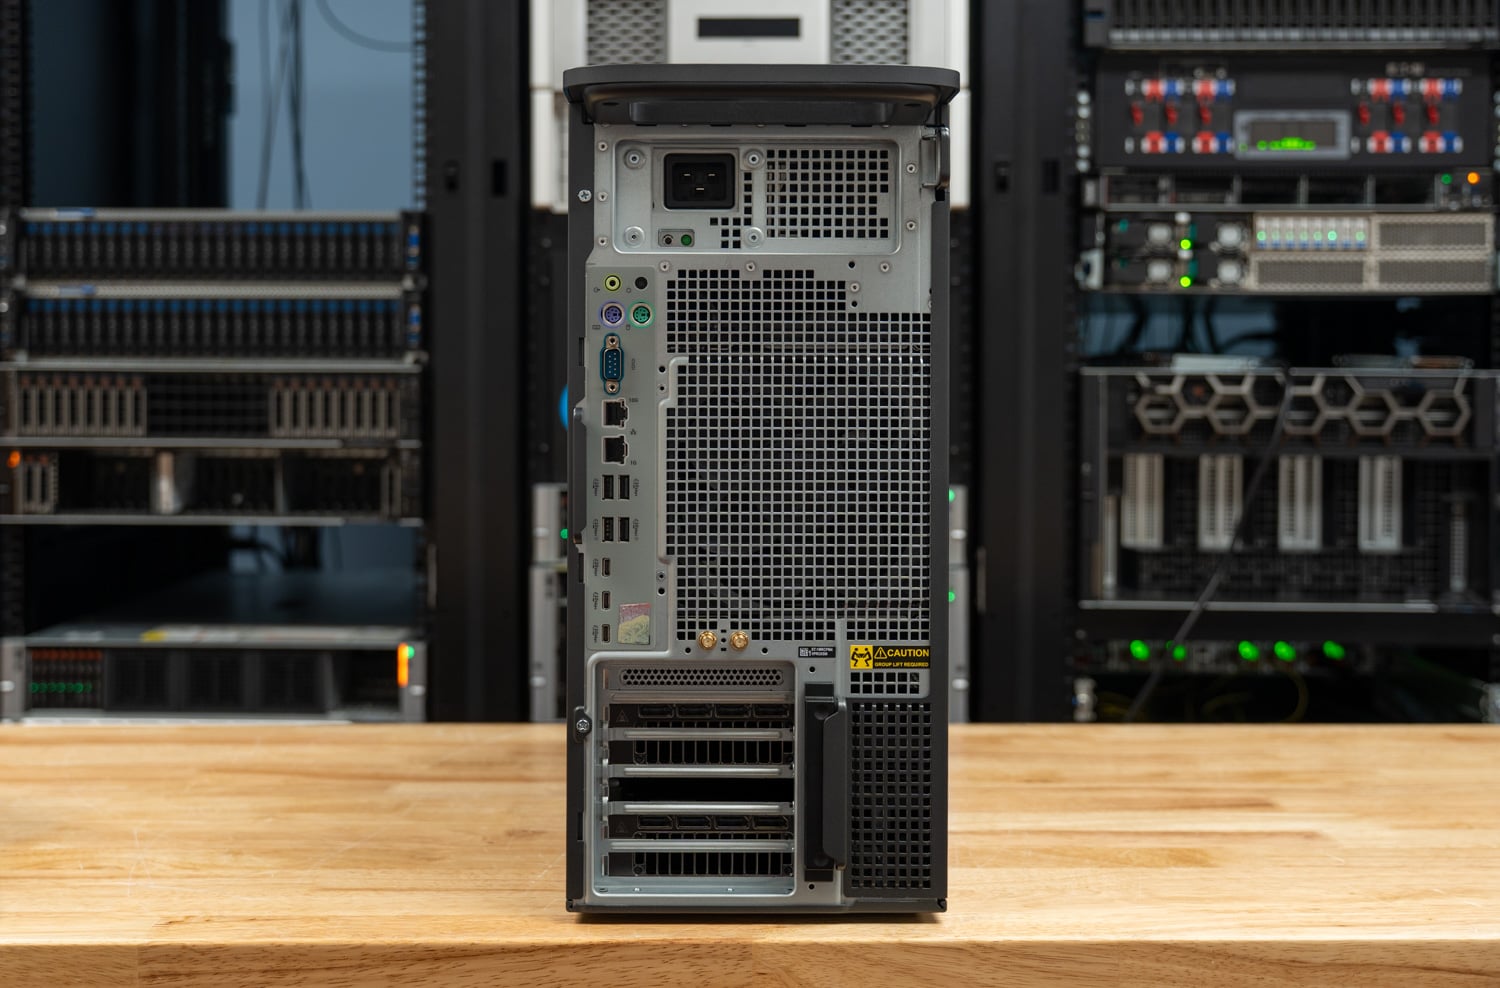
The front panel carries a headset jack, two 10Gbps USB-A ports, a 20Gbps USB-C port with PowerShare, a 10Gbps USB-C port, and an optional SD card slot. The rear adds 10GbE and 1GbE RJ-45 ports, four 10Gbps USB-A ports, two 10Gbps USB-C ports, a 20Gbps USB-C port, serial, two PS/2 ports, and line-out. Our unit adds the Intel E810-XXV dual-port 25GbE SFP28 adapter, MediaTek Wi-Fi 7 MT7925 with Bluetooth 5.4, a media card reader, and Dell’s dual USB-C add-in card.
Security and management cover a TPM 2.0, Dell SafeBIOS, chassis intrusion detection, self-encrypting drive support, BIOS secure erase, and Intel vPro Enterprise. Dell lists the T4 at up to 85 percent recycled plastic in key components, 90 percent recycled aluminum in the handles, and 11 percent recycled steel in the chassis, and the configuration is ENERGY STAR qualified.
Dell Pro Precision 9 T4 Specifications
| Specification | Dell Pro Precision 9 T4 (as tested) |
|---|---|
| Platform | |
| Model | Dell Pro Precision 9 T4 (PW9T4260) |
| Processor | Intel Xeon 698X, 86 cores, 172 threads, 336MB cache, 2.0GHz base, up to 4.8GHz, 350W |
| Processor Options | Xeon 634 (12 cores) through Xeon 698X (86 cores) |
| Memory | 256GB (8x 32GB) DDR5-6400 RDIMM ECC 16 slots, up to 4TB |
| Graphics | 2x NVIDIA RTX PRO 6000 Blackwell Max-Q Workstation Edition, 96GB GDDR7 each, 300W each |
| Operating System | Windows 11 Pro for Workstations (tested on Ubuntu 26.04.1 LTS) |
| Storage | |
| As Configured | 2x 2TB M.2 2280 Gen5 x4 TLC SED (both in internal M.2 slots) |
| Internal Slots | 3x M.2 2230/2280 Gen5 NVMe 1x M.2 2230/2280 Gen4 NVMe 2x 3.5-inch SATA |
| FlexBay | Up to 4 NVMe drives plus optional slim ODD, or 2x 3.5-inch SATA |
| Expansion and Connectivity | |
| PCIe Slots | 2x Gen5 x16 1x Gen5 x8 1x Gen4 x8 2x Gen4 x8 (x4 electrical) |
| Networking | Intel E810-XXV dual-port 25GbE SFP28 (add-in) Onboard 10GbE and 1GbE RJ-45 MediaTek Wi-Fi 7 MT7925, Bluetooth 5.4 |
| Front Ports | 1x USB-C 20Gbps with PowerShare 1x USB-C 10Gbps 2x USB-A 10Gbps Headset jack Optional SD card slot |
| Rear Ports | 1x USB-C 20Gbps 2x USB-C 10Gbps 4x USB-A 10Gbps Serial, 2x PS/2, line-out |
| Power and Physical | |
| Power Supply | 2400W Platinum (1500W option) |
| Dimensions | 449.8 x 203.7 x 617.5mm (17.70 x 8.01 x 24.31in) |
| Weight | 24.1kg to 33.6kg (53.1 to 74.1lb) by configuration |
| Warranty | ProSupport with onsite service after remote diagnosis, 36 months |
| Price | $5,925 base About $66,600 as configured (Dell.com) |
Test Setup and Methodology
We test high-end workstations on Linux, and all four systems in this review ran Ubuntu 26.04.1 LTS on kernel 7.0.0-43 with NVIDIA driver 595.99.02, CUDA 13, llama.cpp build b11716, and Ollama 0.40.3, on the Linux performance power profile. Results come from three tools: sr-client for local AI and client workloads, sr-harness for compile, compression, crypto, web serving, and y-cruncher, and sr-suite r5.28 for GROMACS, OpenFOAM, ClickHouse, Valkey, and memory bandwidth. Each result is the median of repeated passes.
All four systems ran with the BIOS thermal mode set to Ultra Performance, and the T4 ran BIOS 1.2.0. The T4 harness run used sr-harness 3.3, the Precision 7875 used 3.5, and both T2s used 3.6, with the same test lineup across those releases.
Every comparison system is a Dell tower with RTX PRO 6000 Blackwell graphics. The Dell Precision 7875 pairs the 96-core Threadripper PRO 9995WX with the same two RTX PRO 6000 Max-Q cards and 512GB of DDR5-5600, which makes it the closest match. The Dell Pro Precision 9 T2 runs the 24-core Xeon 658X with one Max-Q card, and the Dell Pro Max Tower T2 runs the 24-core Core Ultra 9 285K with the 600W RTX PRO 6000, which shows what the higher power limit adds per GPU.
| Configuration | CPU | Memory | GPU | Test Drive | BIOS Thermal Mode |
|---|---|---|---|---|---|
| Dell Pro Precision 9 T4 | Xeon 698X, 86 cores | 256GB DDR5-6400 (8 channels) | 2x RTX PRO 6000 Max-Q (300W) | 2TB SK hynix PCB01 Gen5 | Ultra Performance |
| Dell Precision 7875 | Threadripper PRO 9995WX, 96 cores | 512GB DDR5-5600 (8 channels) | 2x RTX PRO 6000 Max-Q (300W) | 2TB Samsung Gen4 | Ultra Performance |
| Dell Pro Precision 9 T2 | Xeon 658X, 24 cores | 128GB DDR5-6400 (4 channels) | 1x RTX PRO 6000 Max-Q (300W) | Samsung PM9E1 Gen5, 2TB drives in a striped array | Ultra Performance |
| Dell Pro Max Tower T2 | Core Ultra 9 285K, 24 cores | 128GB DDR5-4400 (2 channels) | 1x RTX PRO 6000 (600W) | 2TB Samsung PM9F1 Gen4 | Ultra Performance |
Local AI Performance
Every system here carries at least one RTX PRO 6000 Blackwell with 96GB of GDDR7, so the single-GPU results measure the card, its power limit, and how quickly the platform feeds it. The T4’s two cards are what set it apart, and our two-GPU tests run each model three ways where it applies: two independent servers, one per GPU, for throughput; one model split by layer across both cards; and, for MiniMax M2.7, one card with the rest of the model in system memory.
LLM Serving on One GPU
| llama.cpp server, one GPU (output tokens/s, higher is better) | Dell Pro Precision 9 T4 | Dell Precision 7875 | Dell Pro Precision 9 T2 | Dell Pro Max Tower T2 |
|---|---|---|---|---|
| Ministral 3 3B, one request | 240.5 | 252.6 | 243.8 | 261.6 |
| Ministral 3 3B, peak | 582.5 | 637.6 | 602.6 | 658.8 |
| Ministral 3 8B, one request | 166.8 | 171.1 | 167.3 | 194.5 |
| Ministral 3 8B, peak | 383.6 | 398.9 | 384.9 | 477.5 |
| Qwen3.8 27B, one request | 54.9 | 55.4 | 53.8 | 64.5 |
| Qwen3.8 27B, peak | 158.1 | 162.8 | 155.8 | 194.7 |
| gpt-oss 120B, one request | 166.9 | 171.2 | 164.5 | 193.0 |
| gpt-oss 120B, peak | 424.8 | 458.4 | 413.1 | 520.7 |
| gpt-oss 120B, one request, time to first token (ms, lower is better) | 1,189 | 1,181 | 1,213 | 844 |
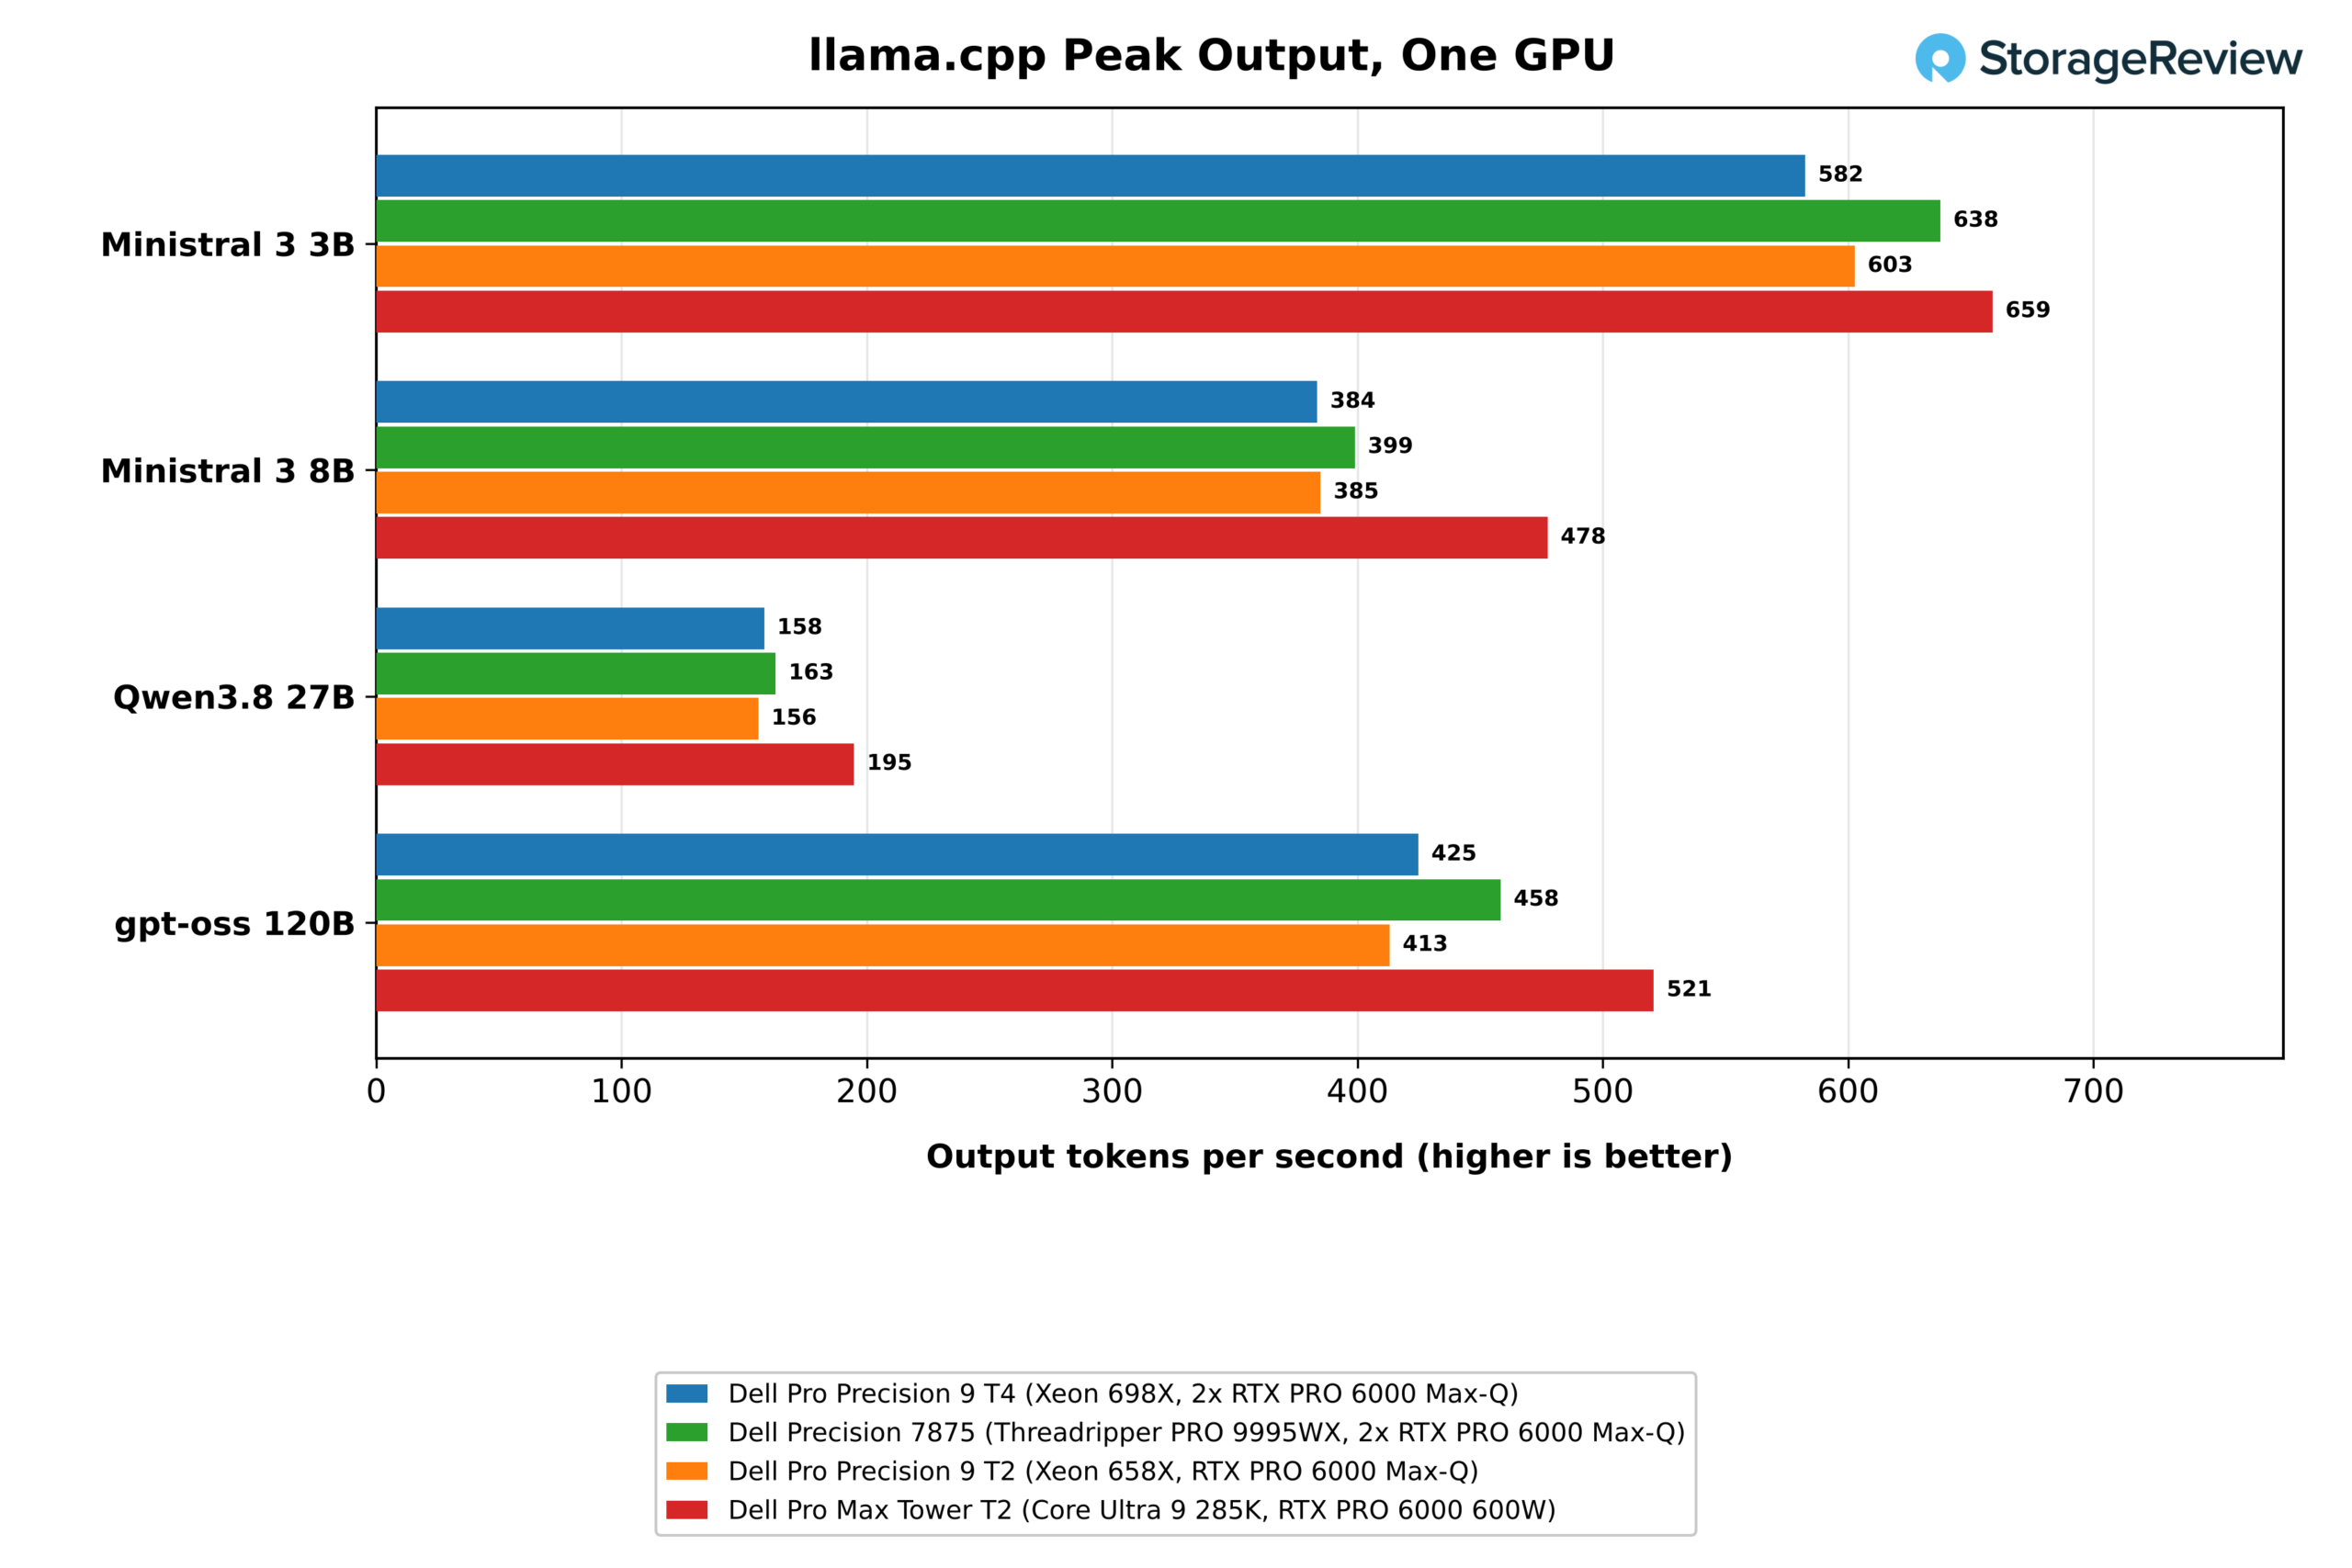
On one GPU, the T4 lands where the card’s 300W limit puts it. It generated 166.9 tokens per second for one user on gpt-oss 120B and peaked at 424.8 across 64 concurrent requests, within 1 to 9 percent of the Precision 7875’s identical Max-Q card across all four models and level with the Pro Precision 9 T2. The 600W card in the Pro Max Tower T2 is 13 to 25 percent faster at peak on every model, reaching 520.7 tokens per second on gpt-oss 120B.
Two GPUs: Replicas and Split Models
| llama.cpp server, two GPUs (output tokens/s, higher is better) | Dell Pro Precision 9 T4 | Dell Precision 7875 |
|---|---|---|
| Ministral 3 3B, peak, one server per GPU | 1,176.1 | 1,260.2 |
| Ministral 3 8B, peak, one server per GPU | 765.7 | 796.4 |
| Qwen3.8 27B, peak, one server per GPU | 310.8 | 323.2 |
| gpt-oss 120B, peak, one server per GPU | 787.9 | 905.8 |
| gpt-oss 120B, one request, split by layer | 170.6 | 182.4 |
| gpt-oss 120B, peak, split by layer | 539.2 | 619.4 |
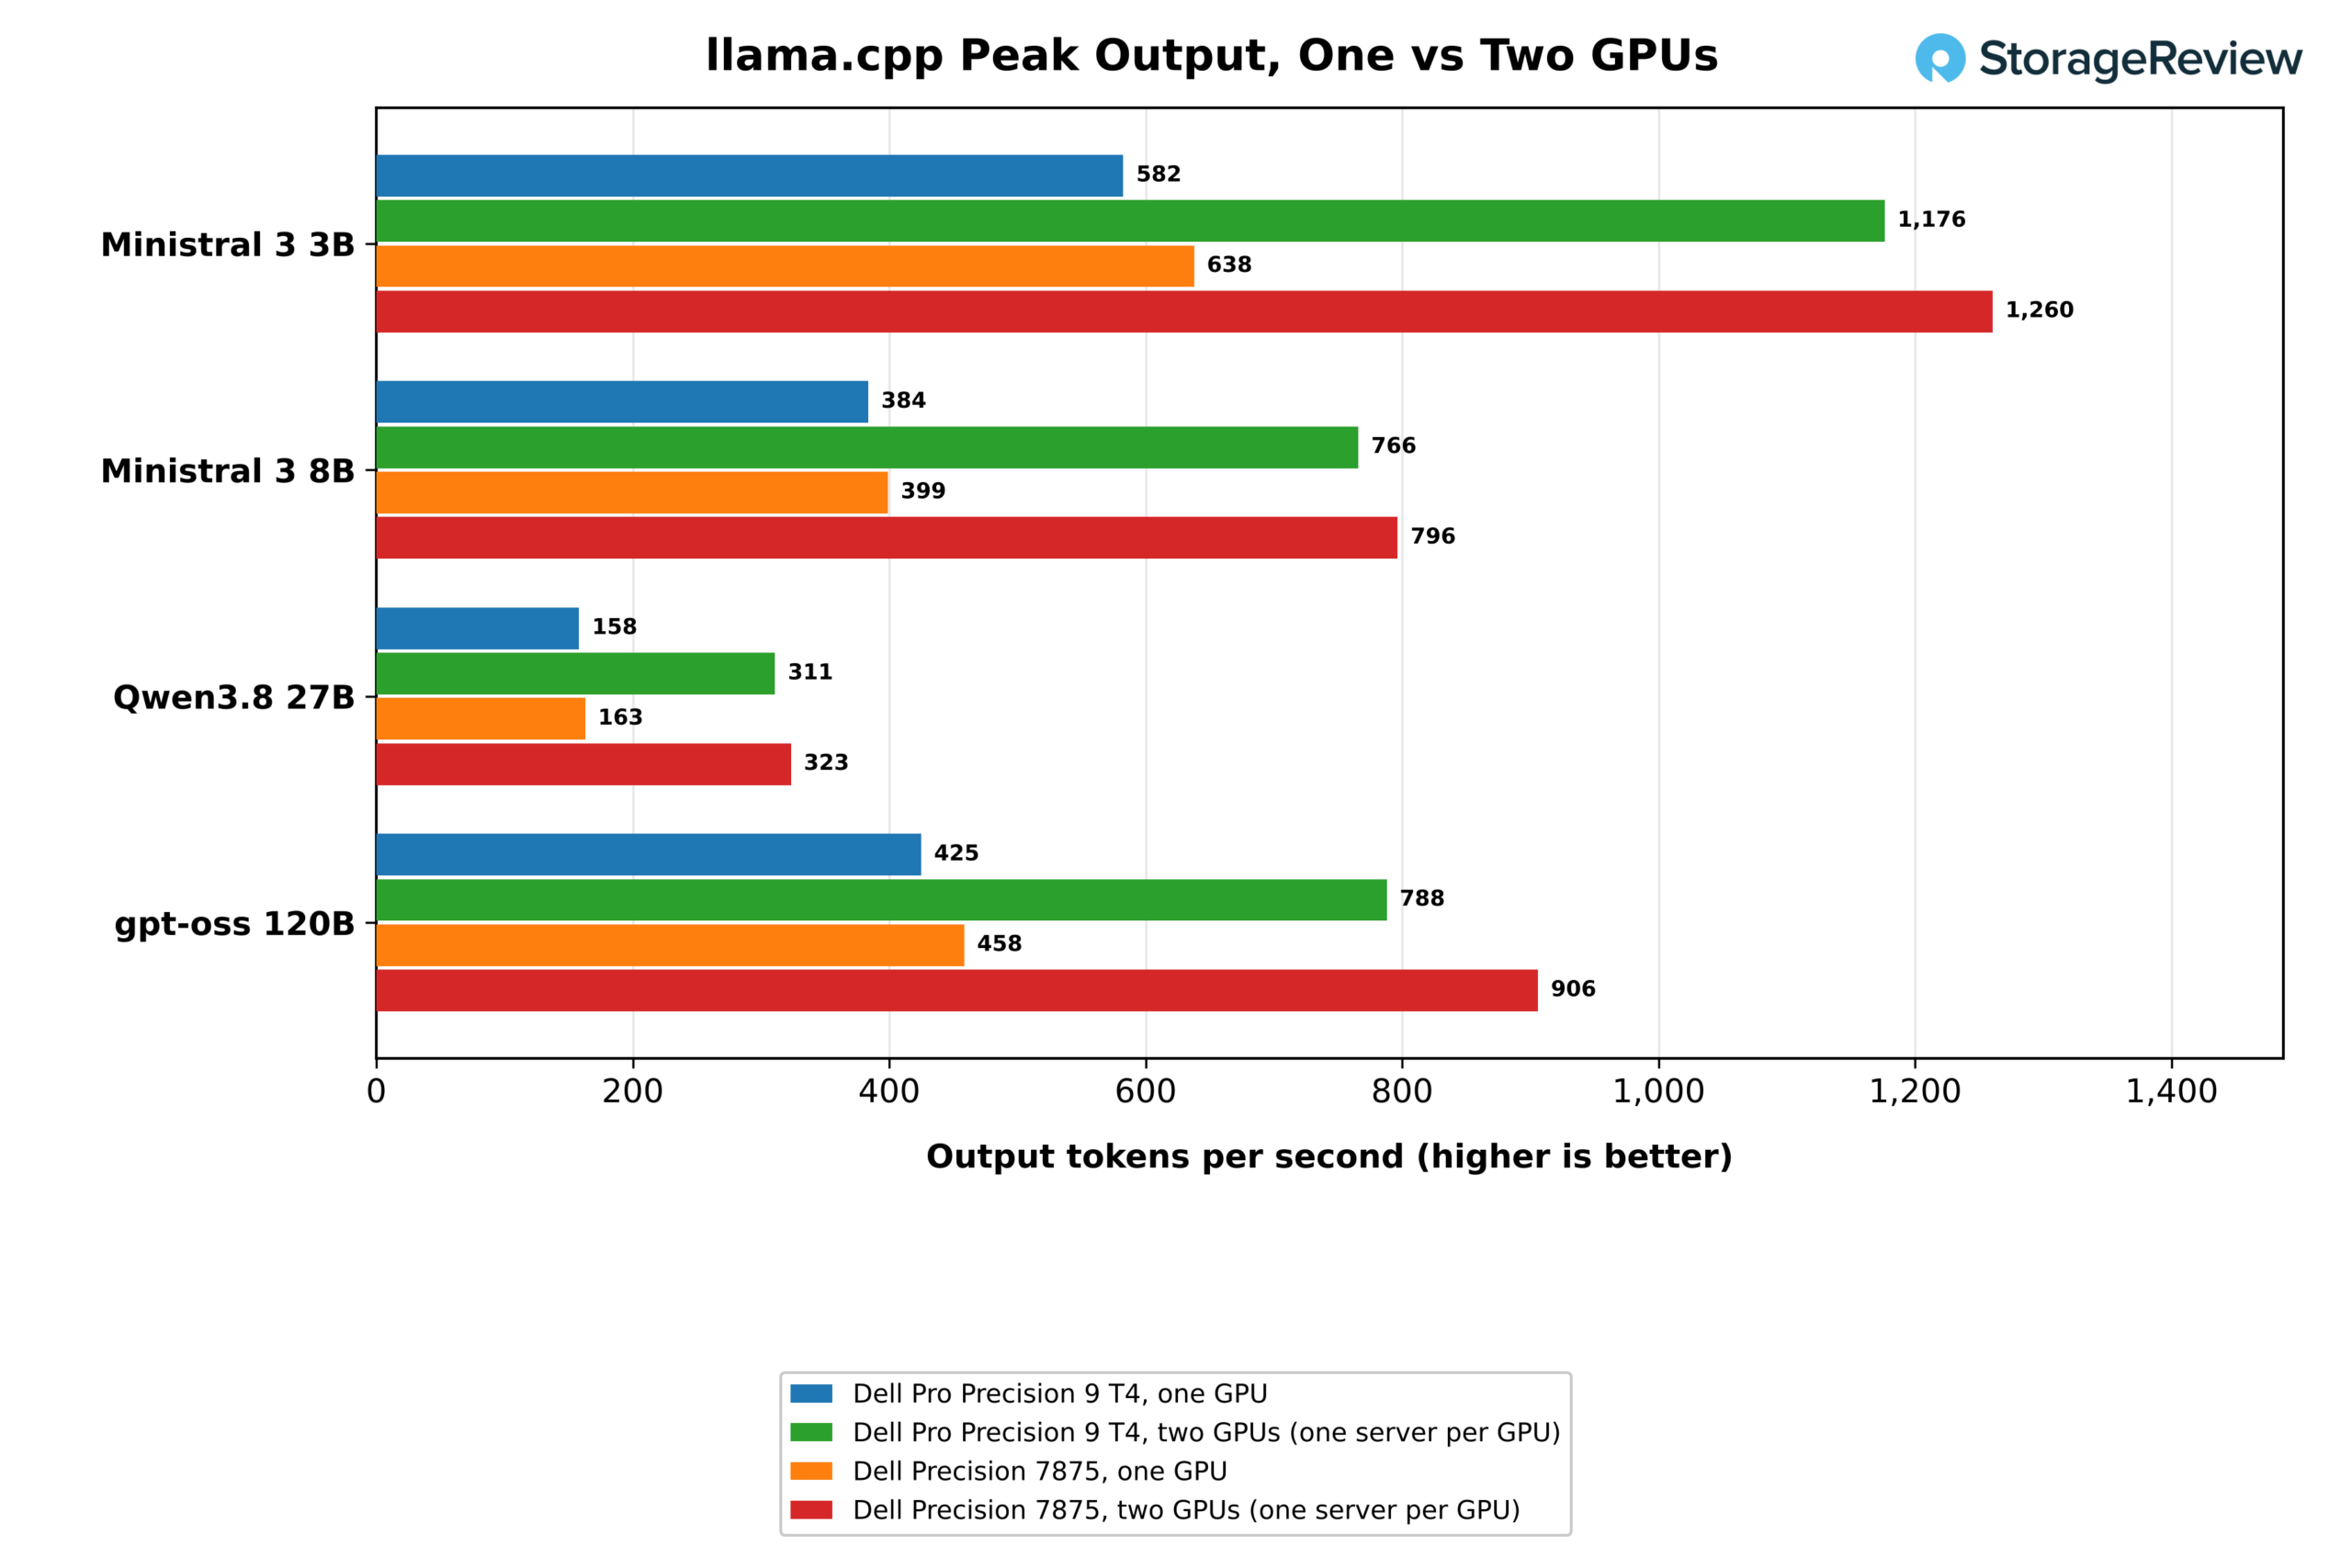
Running one server per GPU raised the T4’s peak output by 1.85 to 2.02 times across the four models. Peak output rose from 582.5 to 1,176.1 tokens per second on Ministral 3 3B, from 383.6 to 765.7 on the 8B model, and from 158.1 to 310.8 on Qwen3.8 27B, scaling by 1.97 to 2.02 times. gpt-oss 120B scaled 1.85 times to 787.9 tokens per second on the T4 and 1.98 times to 905.8 on the Precision 7875, which reached its peak at 128 concurrent requests, where the T4 peaked at 64.
Splitting gpt-oss 120B by layer across both cards is the slower way to use the second GPU when the model already fits on one. It served one user at 170.6 tokens per second, within 3 percent of a single card, and peaked at 539.2, 27 percent above one GPU and well short of the 787.9 that two replicas delivered. The split layout earns its place with models that do not fit on one card, which is where MiniMax M2.7 comes in.
| llama.cpp server, gpt-oss 120B, 8,192-token prompts, 1,024-token outputs | T4, one GPU | T4, two GPUs, one server per GPU | T4, two GPUs, split by layer | Precision 7875, two GPUs, one server per GPU |
|---|---|---|---|---|
| 1 concurrent: total throughput (tokens/s) | 1,502 | 1,504 | 1,536 | 1,530 |
| 1 concurrent: time to first token, median (ms, lower is better) | 1,189 | 1,180 | 719 | 1,189 |
| 8 concurrent: total throughput (tokens/s) | 2,760 | 4,820 | 3,300 | 4,949 |
| 8 concurrent: output per user (tokens/s) | 38.3 | 66.9 | 45.8 | 68.7 |
| 8 concurrent: time to first token, median (ms, lower is better) | 2,654 | 2,523 | 1,622 | 2,472 |
| 64 concurrent: total throughput (tokens/s) | 3,823 | 7,091 | 4,853 | 7,557 |
| 64 concurrent: output per user (tokens/s) | 6.6 | 12.3 | 8.4 | 13.1 |
| 64 concurrent: time to first token, median (ms, lower is better) | 3,874 | 3,226 | 2,852 | 2,867 |
The full sweep on gpt-oss 120B shows how the second card changes the curve, with total throughput counting prompt and output tokens together. One GPU climbed from 1,502 tokens per second for a single request to 2,760 at eight and 3,823 at 64, where each user received 6.6 output tokens per second. With one server per GPU, eight requests ran at 4,820 and 64 requests reached 7,091, 1.85 times one card, at 12.3 tokens per second per user. Splitting the model peaked lower at 4,853 but returned a single user’s first token in 719ms against 1,189ms.

MiniMax M2.7: A Model Too Big for One Card
| MiniMax M2.7 Q4_K_M, 129.3GB (higher is better unless noted) | Dell Pro Precision 9 T4 | Dell Precision 7875 | Dell Pro Precision 9 T2 | Dell Pro Max Tower T2 |
|---|---|---|---|---|
| One GPU plus system RAM, one request (tokens/s) | 30.3 | 32.8 | 22.6 | 15.8 |
| One GPU plus system RAM, peak (tokens/s) | 35.5 | 39.1 | 27.7 | 18.0 |
| One GPU plus system RAM, time to first token (ms, lower is better) | 16,224 | 16,143 | 16,216 | 18,522 |
| Two GPUs split by layer, one request (tokens/s) | 83.7 | 85.0 | Single GPU | Single GPU |
| Two GPUs split by layer, peak (tokens/s) | 127.3 | 129.5 | Single GPU | Single GPU |
| Two GPUs split by layer, time to first token (ms, lower is better) | 3,138 | 3,162 | Single GPU | Single GPU |
| Cold load, one GPU plus RAM (s, lower is better) | 40.5 | 65.8 | 37.6 | 81.1 |
| Cold load, two GPUs split (s, lower is better) | 27.6 | 50.7 | Single GPU | Single GPU |
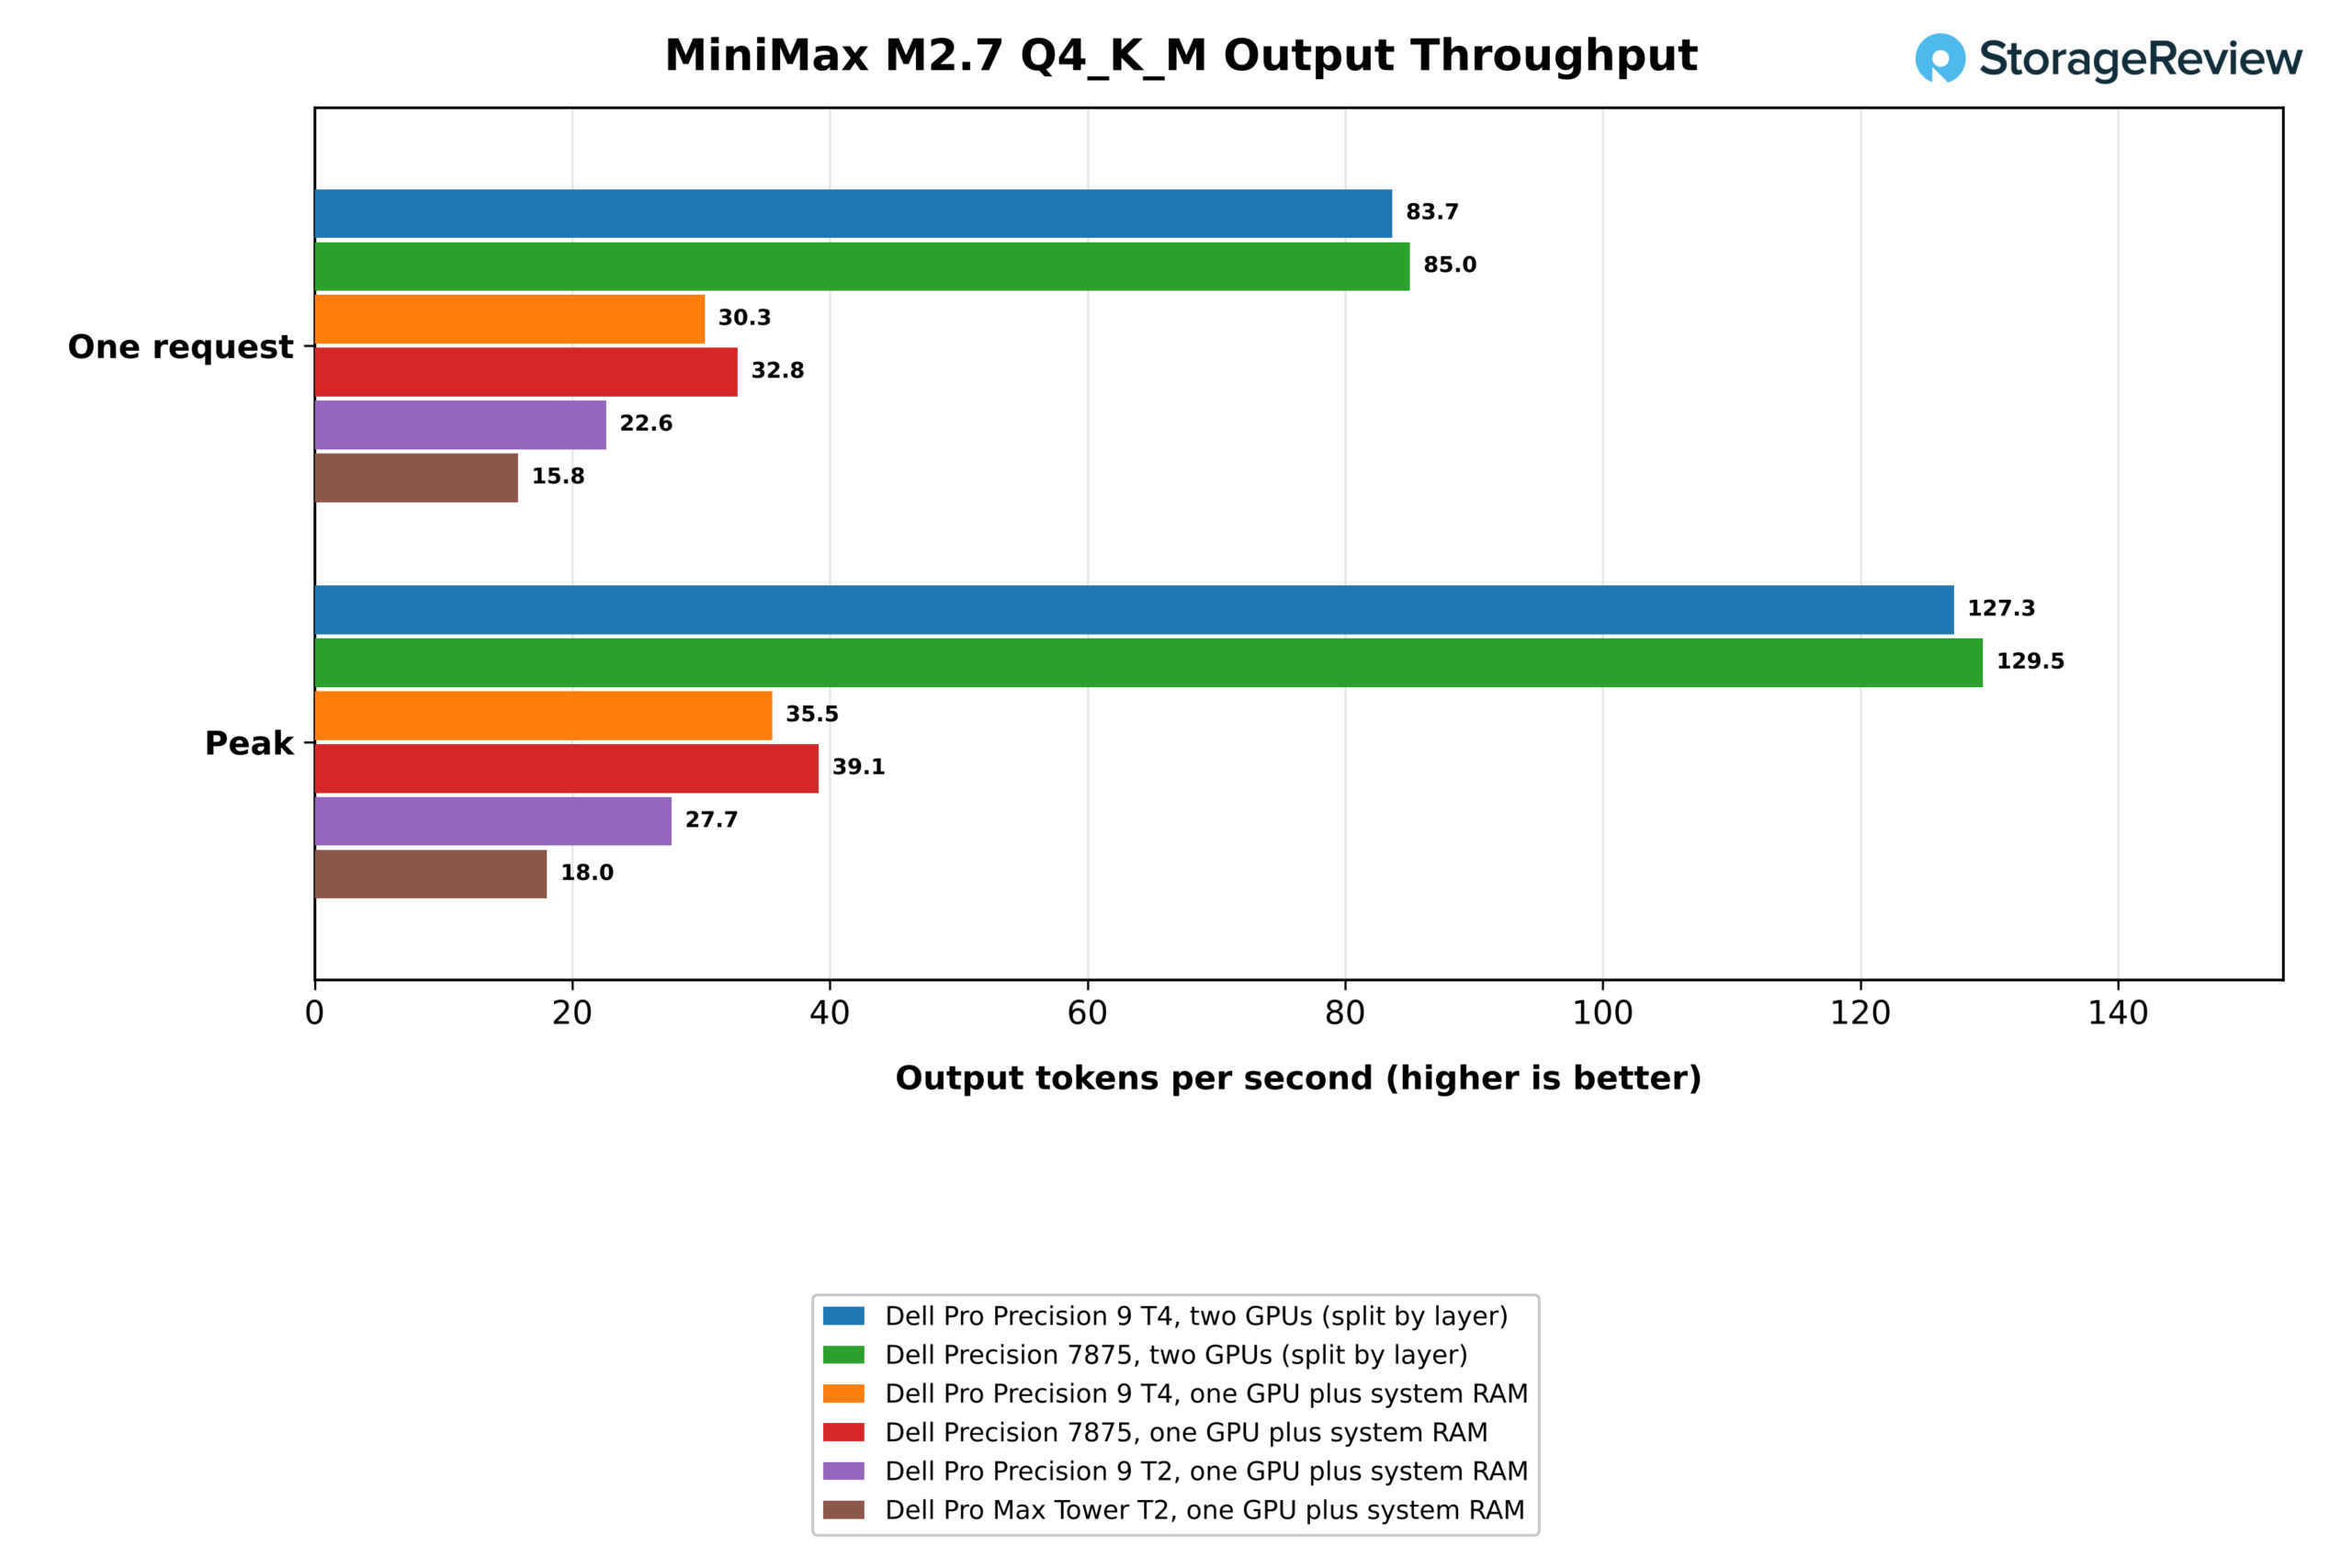
MiniMax M2.7 is a 230-billion-parameter mixture-of-experts model, and our 4-bit quantization takes 129.3GB, more than the 96GB on one RTX PRO 6000. On one card with the remainder in system memory, the T4 generated 30.3 tokens per second for one user and took 16.2 seconds to return the first token. Split across both cards, it generated 83.7 tokens per second, 2.8 times faster, returned the first token in 3.1 seconds, and peaked at 127.3 tokens per second against 35.5.
The one-GPU results show how much the host platform matters once a model spills into system memory. The T4’s eight channels of DDR5-6400 put it 34 percent ahead of the four-channel Pro Precision 9 T2 at 22.6 tokens per second and 1.9 times ahead of the dual-channel Pro Max Tower T2 at 15.8, even though the Pro Max Tower T2’s 600W card is faster on every model that fits. The Precision 7875 edged the T4 at 32.8 tokens per second with 35 percent less memory bandwidth, so bandwidth alone does not decide this result. We report the 7875’s lead as measured and have not isolated its cause.
Model Loading
| Ollama 0.40.3 and llama.cpp model load (s, lower is better) | Dell Pro Precision 9 T4 | Dell Precision 7875 | Dell Pro Precision 9 T2 | Dell Pro Max Tower T2 |
|---|---|---|---|---|
| gpt-oss:20b (12.8GB), cold | 5.79 | 7.61 | 5.57 | 7.95 |
| gpt-oss:20b, warm | 3.45 | 2.50 | 3.47 | 3.05 |
| gpt-oss:120b (60.9GB), cold | 15.16 | 25.80 | 15.16 | 28.18 |
| gpt-oss:120b, warm | 7.49 | 5.01 | 7.87 | 6.81 |
| gpt-oss:120b, cold, one copy on each GPU | 26.47 | 35.55 | Single GPU | Single GPU |
| MiniMax M2.7 (129.3GB), cold, one GPU plus RAM | 40.5 | 65.8 | 37.6 | 81.1 |
| MiniMax M2.7, warm, one GPU plus RAM | 28.6 | 15.2 | 36.7 | 80.5 |
Cold model loads favor the Gen5 drives, with the T4 loading gpt-oss:120b from its SK hynix Gen5 SSD in 15.2 seconds, matching the Pro Precision 9 T2 and well ahead of the 25.8 and 28.2 seconds on the Gen4-equipped Precision 7875 and Pro Max Tower T2. Warm loads from the page cache reverse that order, with the 7875 at 5.0 seconds against 7.5 on the T4, and loading a copy onto each GPU at once took 26.5 seconds on the T4.
Retrieval-Augmented Generation at Scale
| RAG over 1,002,067 Wikipedia passages | Dell Pro Precision 9 T4 | Dell Precision 7875 | Dell Pro Precision 9 T2 | Dell Pro Max Tower T2 |
|---|---|---|---|---|
| Embedding, one GPU (passages/s) | 1,126 | 1,196 | 1,141 | 1,388 |
| Embedding wall time, one GPU (s, lower is better) | 890 | 838 | 878 | 722 |
| Embedding, two GPUs (passages/s) | 2,162 | 2,371 | Single GPU | Single GPU |
| Embedding wall time, two GPUs (s, lower is better) | 464 | 423 | Single GPU | Single GPU |
| HNSW index build (s, lower is better) | 27.3 | 34.8 | 46.3 | 118.6 |
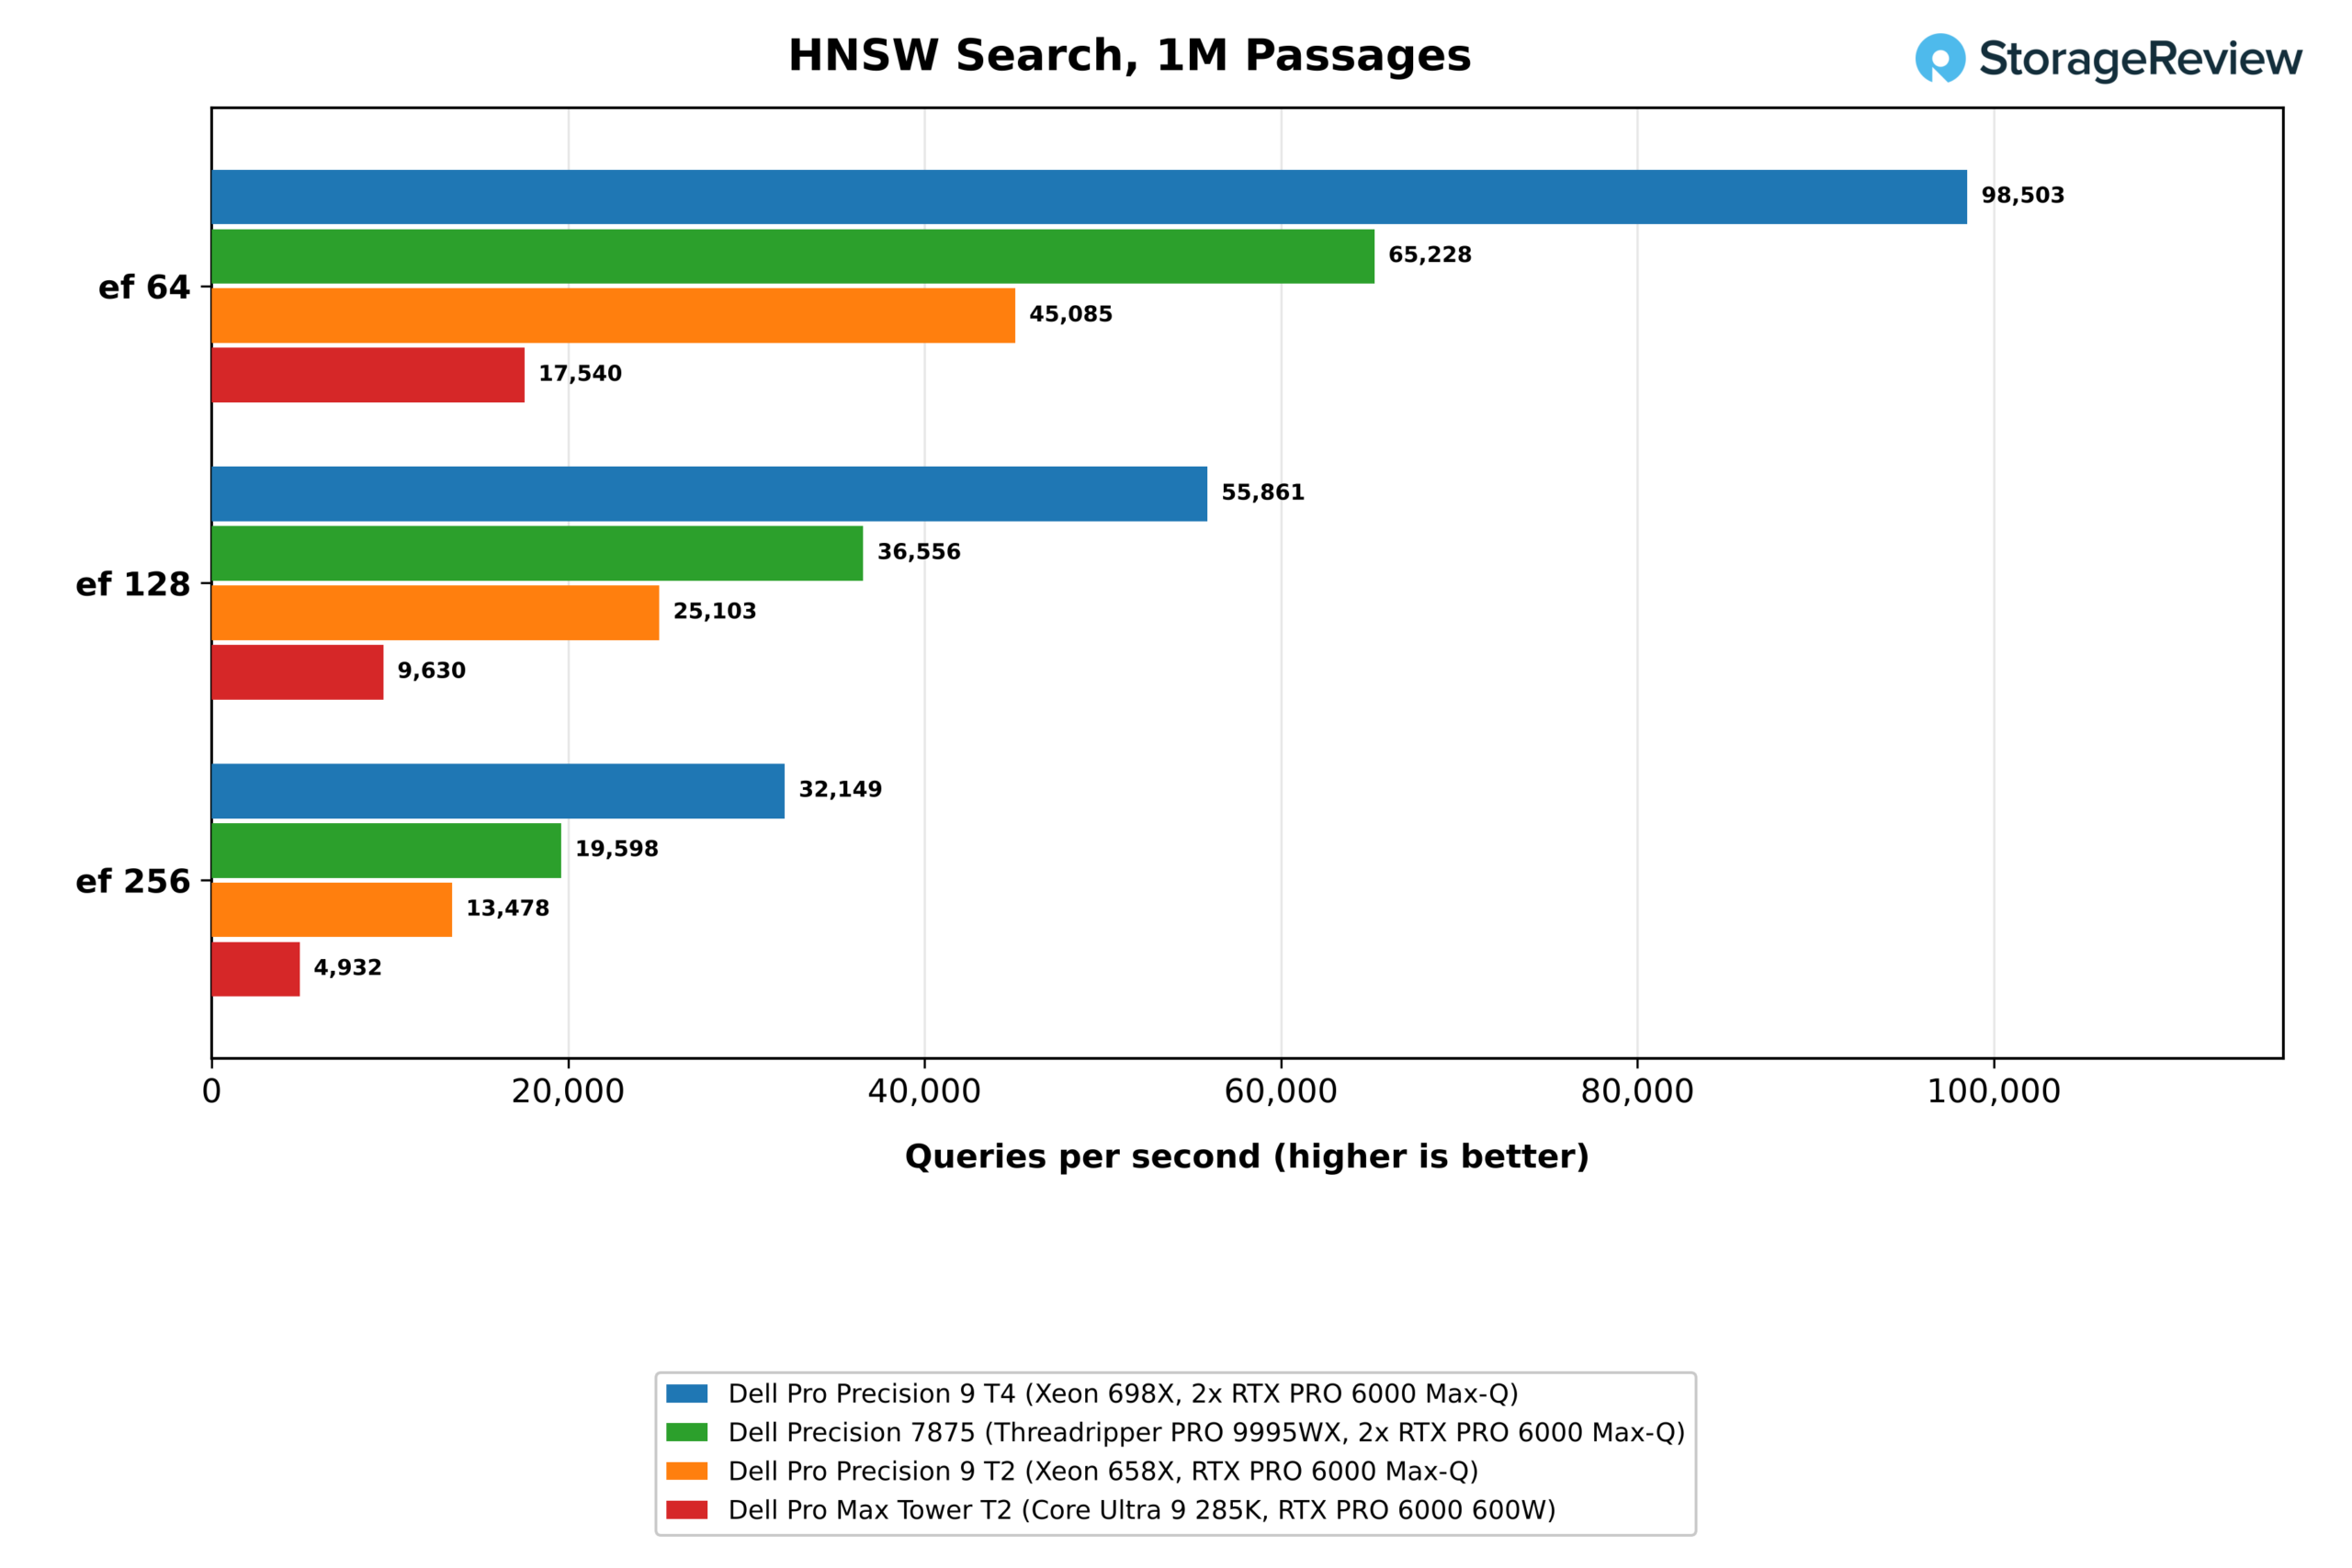
| HNSW search, ef 64 (queries/s) | 98,503 | 65,228 | 45,085 | 17,540 |
| HNSW search, ef 256 (queries/s) | 32,149 | 19,598 | 13,478 | 4,932 |
| Recall@5 vs exact search, ef 256 (%) | 97.59 | 97.67 | 97.26 | 97.70 |
| Question to answer p50 (s, lower is better) | 0.123 | 0.082 | 0.117 | 0.095 |
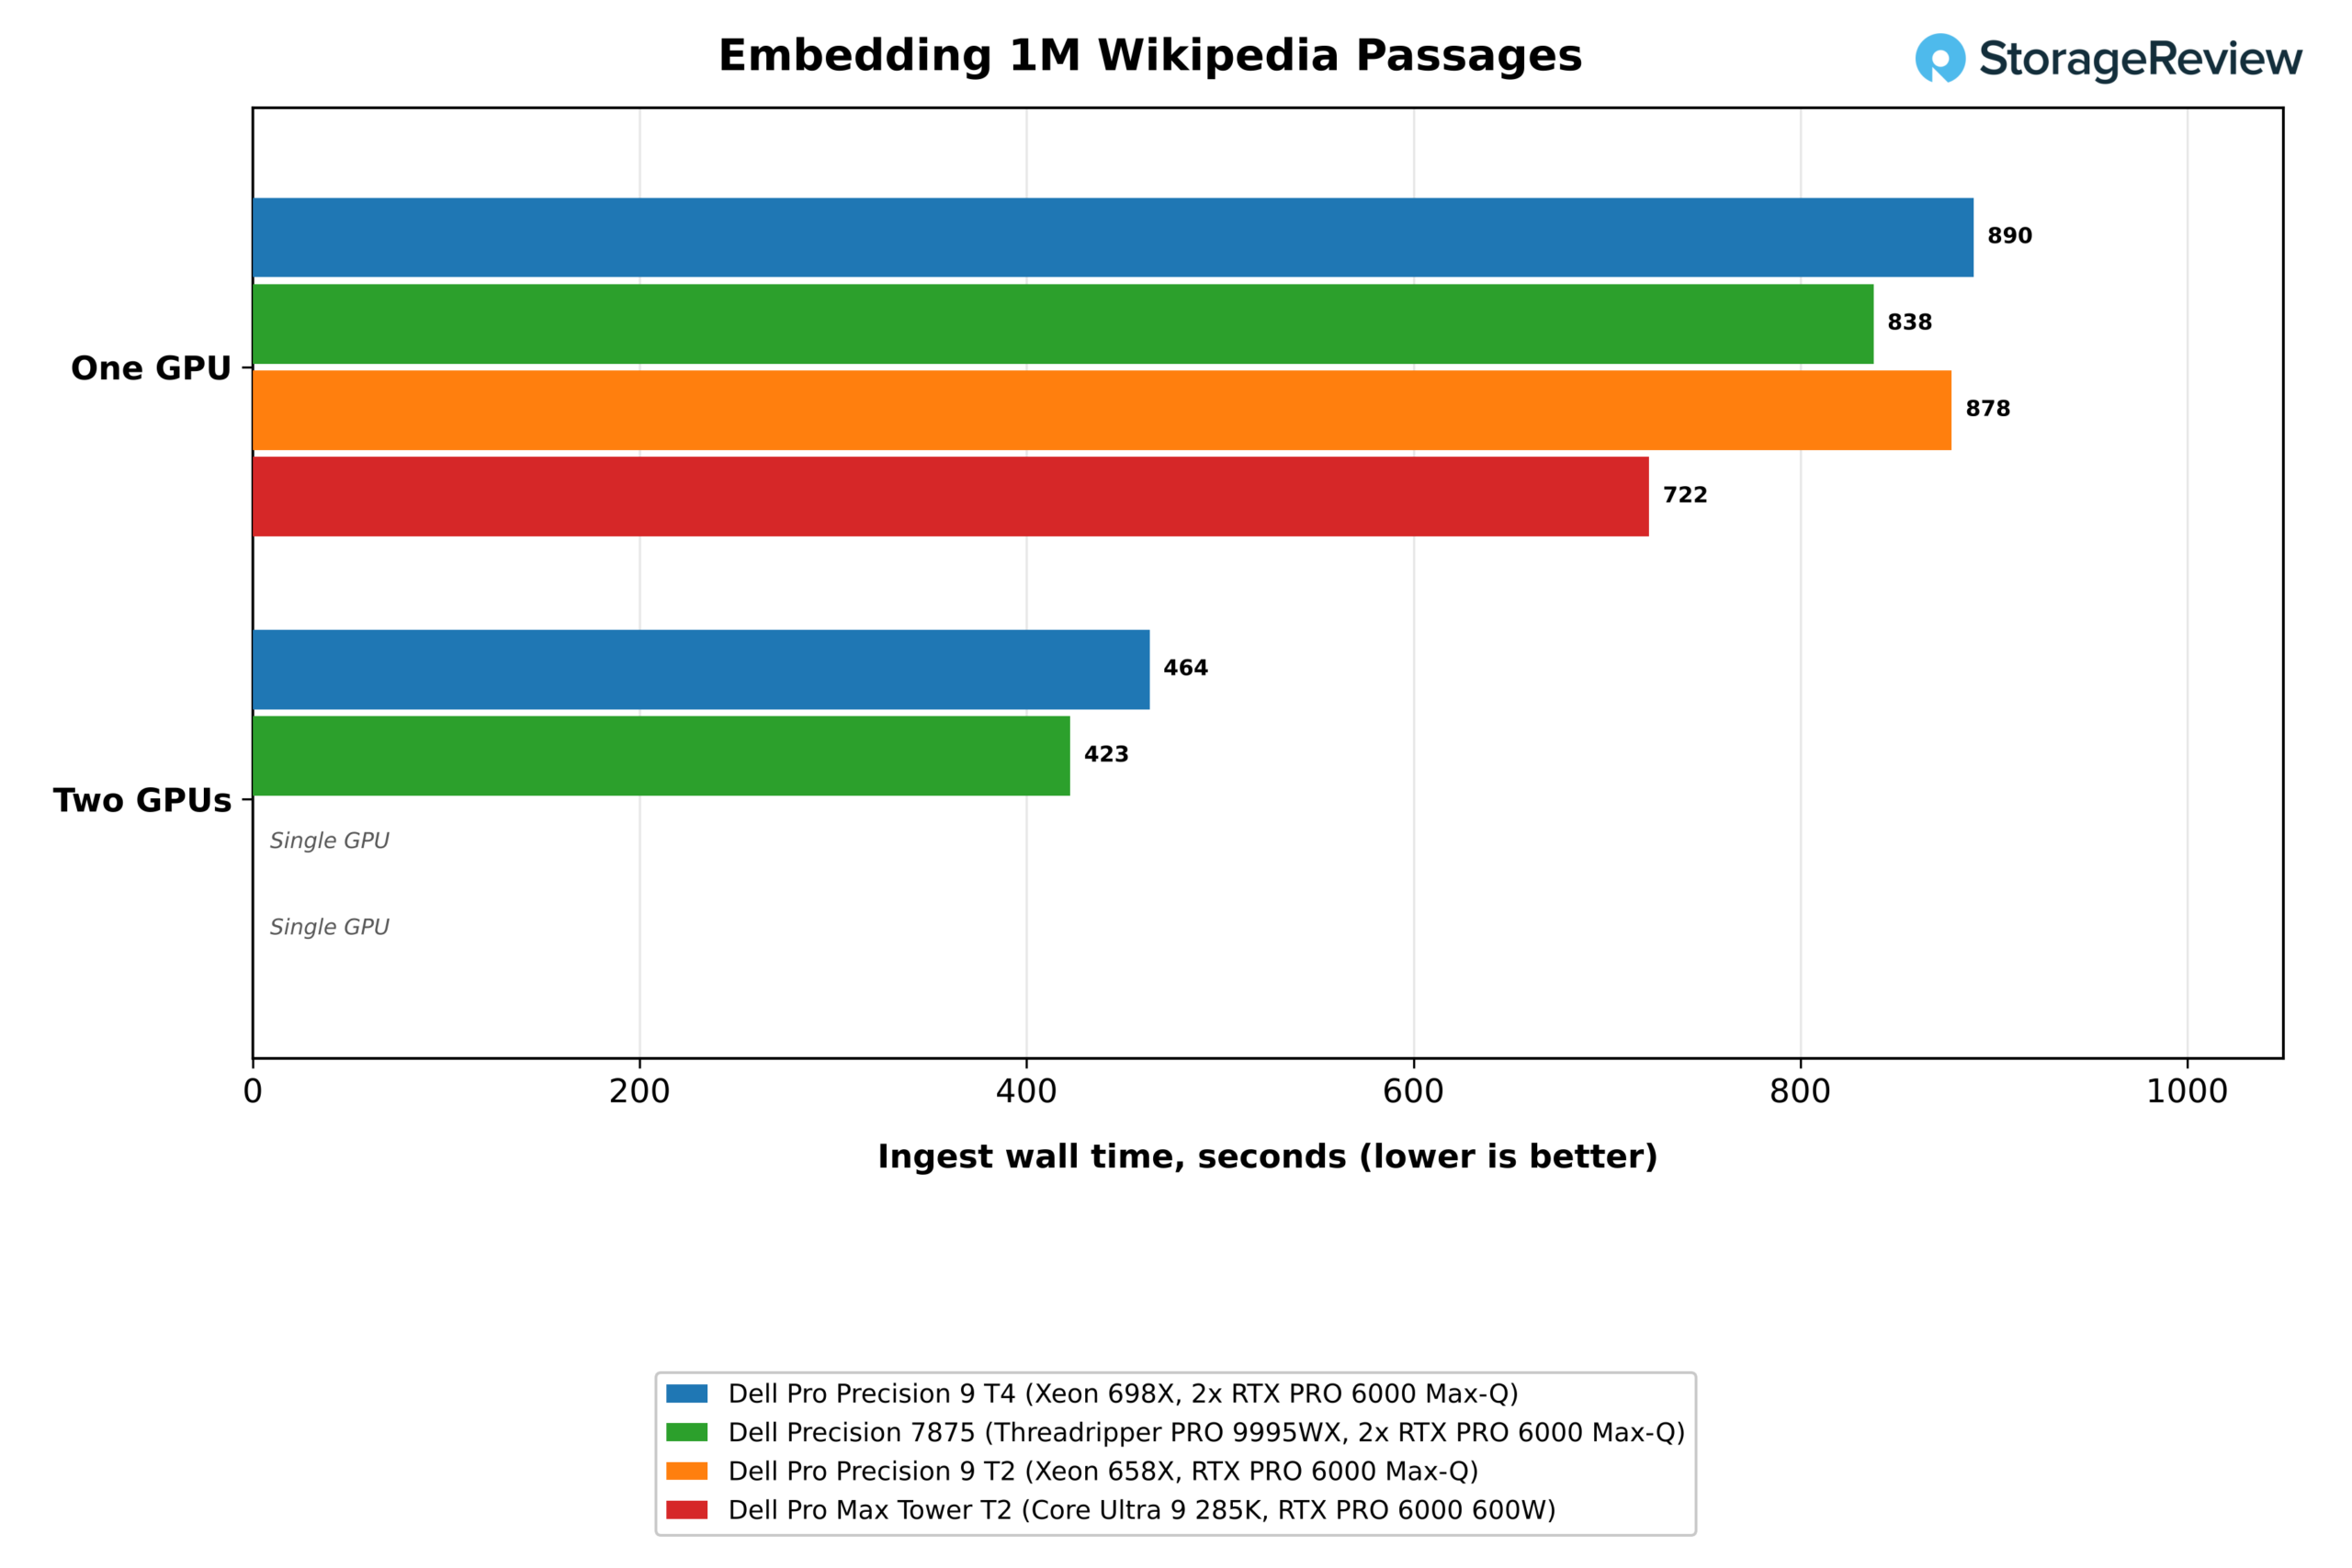
The RAG-at-scale test hides SQuAD questions among a million Wikipedia passages, embeds them with nomic-embed-text, builds an HNSW index, and answers with Phi-4-mini. Embedding took 890 seconds on one T4 GPU and 464 seconds on two, a 1.92x speedup, and the Precision 7875 finished in 423 seconds on two cards. The 600W card in the Pro Max Tower T2 is the fastest single GPU here at 722 seconds.
Index build and vector search run on the CPU, and that is where the T4 leads. It built the HNSW index in 27.3 seconds against 34.8 on the Precision 7875 and 118.6 on the Pro Max Tower T2, and searched at 98,503 queries per second at ef 64, 1.51 times the 7875 and 5.6 times the Core Ultra system. At ef 256, it held 32,149 queries per second with 97.6 percent recall against exact search, and answers came back in a median of 0.12 seconds.
Fine-Tuning
| Ministral 3 8B LoRA, BF16, one epoch of Dolly 15k | Dell Pro Precision 9 T4 | Dell Precision 7875 | Dell Pro Precision 9 T2 | Dell Pro Max Tower T2 |
|---|---|---|---|---|
| Epoch training time, one GPU (minutes, lower is better) | 31.5 | 27.2 | 30.6 | 22.3 |
| Throughput, one GPU (tokens/s) | 1,584 | 1,834 | 1,631 | 2,236 |
| Held-out loss before and after training, one GPU | 1.534 to 1.169 | 1.534 to 1.172 | 1.534 to 1.167 | 1.534 to 1.167 |
| Epoch training time, two GPUs (minutes, lower is better) | 19.7 | 18.1 | Single GPU | Single GPU |
| Throughput, two GPUs (tokens/s) | 2,528 | 2,754 | Single GPU | Single GPU |
| Speedup from the second GPU | 1.60x | 1.50x | Single GPU | Single GPU |
| Held-out loss after training, two GPUs | 1.167 | 1.168 | Single GPU | Single GPU |
The one-epoch LoRA test fine-tunes Ministral 3 8B in BF16 on Dolly 15k across 1,849 steps and scores 200 held-out examples every 100 steps. Every system started at a held-out loss of 1.534 and finished between 1.167 and 1.172, so the result that separates them is the time the epoch takes. One T4 GPU finished in 31.5 minutes at 1,584 tokens per second, within 3 percent of the Pro Precision 9 T2 on the same Max-Q card. The Precision 7875 took 27.2 minutes, and the 600W card in the Pro Max Tower T2 took 22.3.
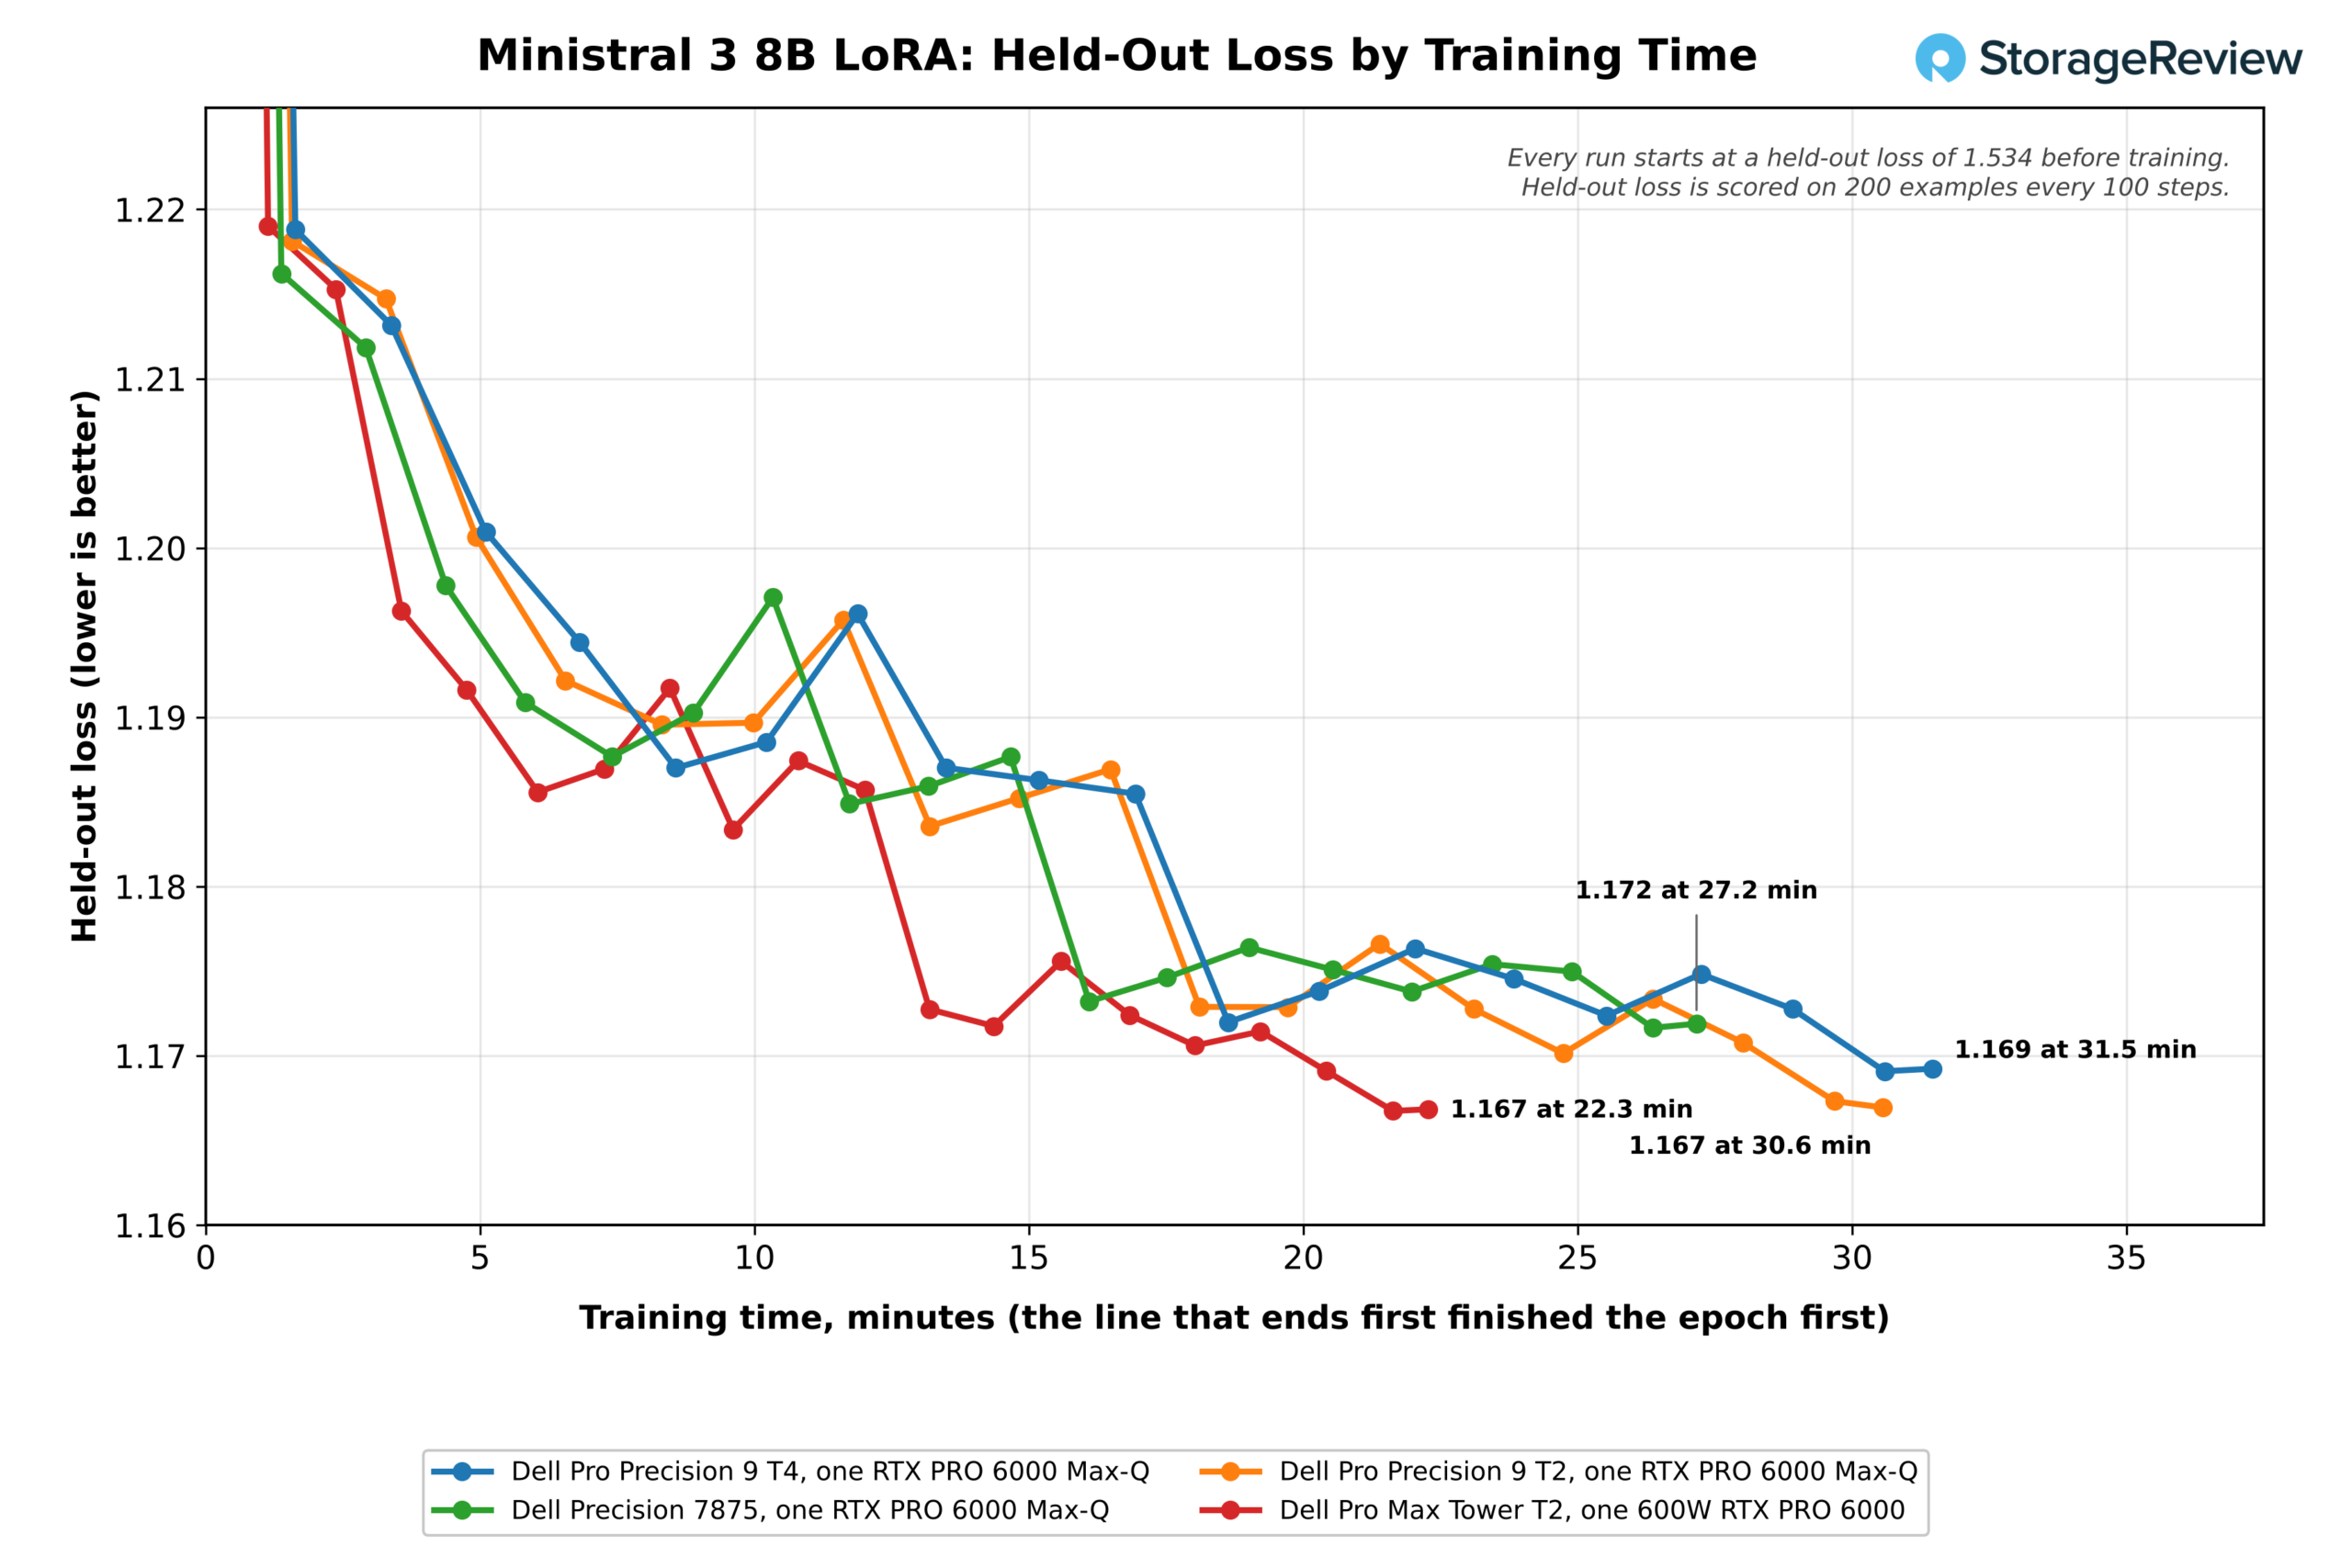
Held-out loss on the T4 fell from 1.534 to 1.219 in the first 100 steps, 1.6 minutes into training, and then eased to 1.169 over the rest of the epoch. Adding the second GPU cut the T4’s epoch to 19.7 minutes at 2,528 tokens per second, a 1.60x speedup that finished ahead of the single 600W card’s 22.3 minutes. The Precision 7875 completed its two-GPU epoch in 18.1 minutes, a 1.50x speedup, and the two-GPU runs ended at held-out losses of 1.167 and 1.168.
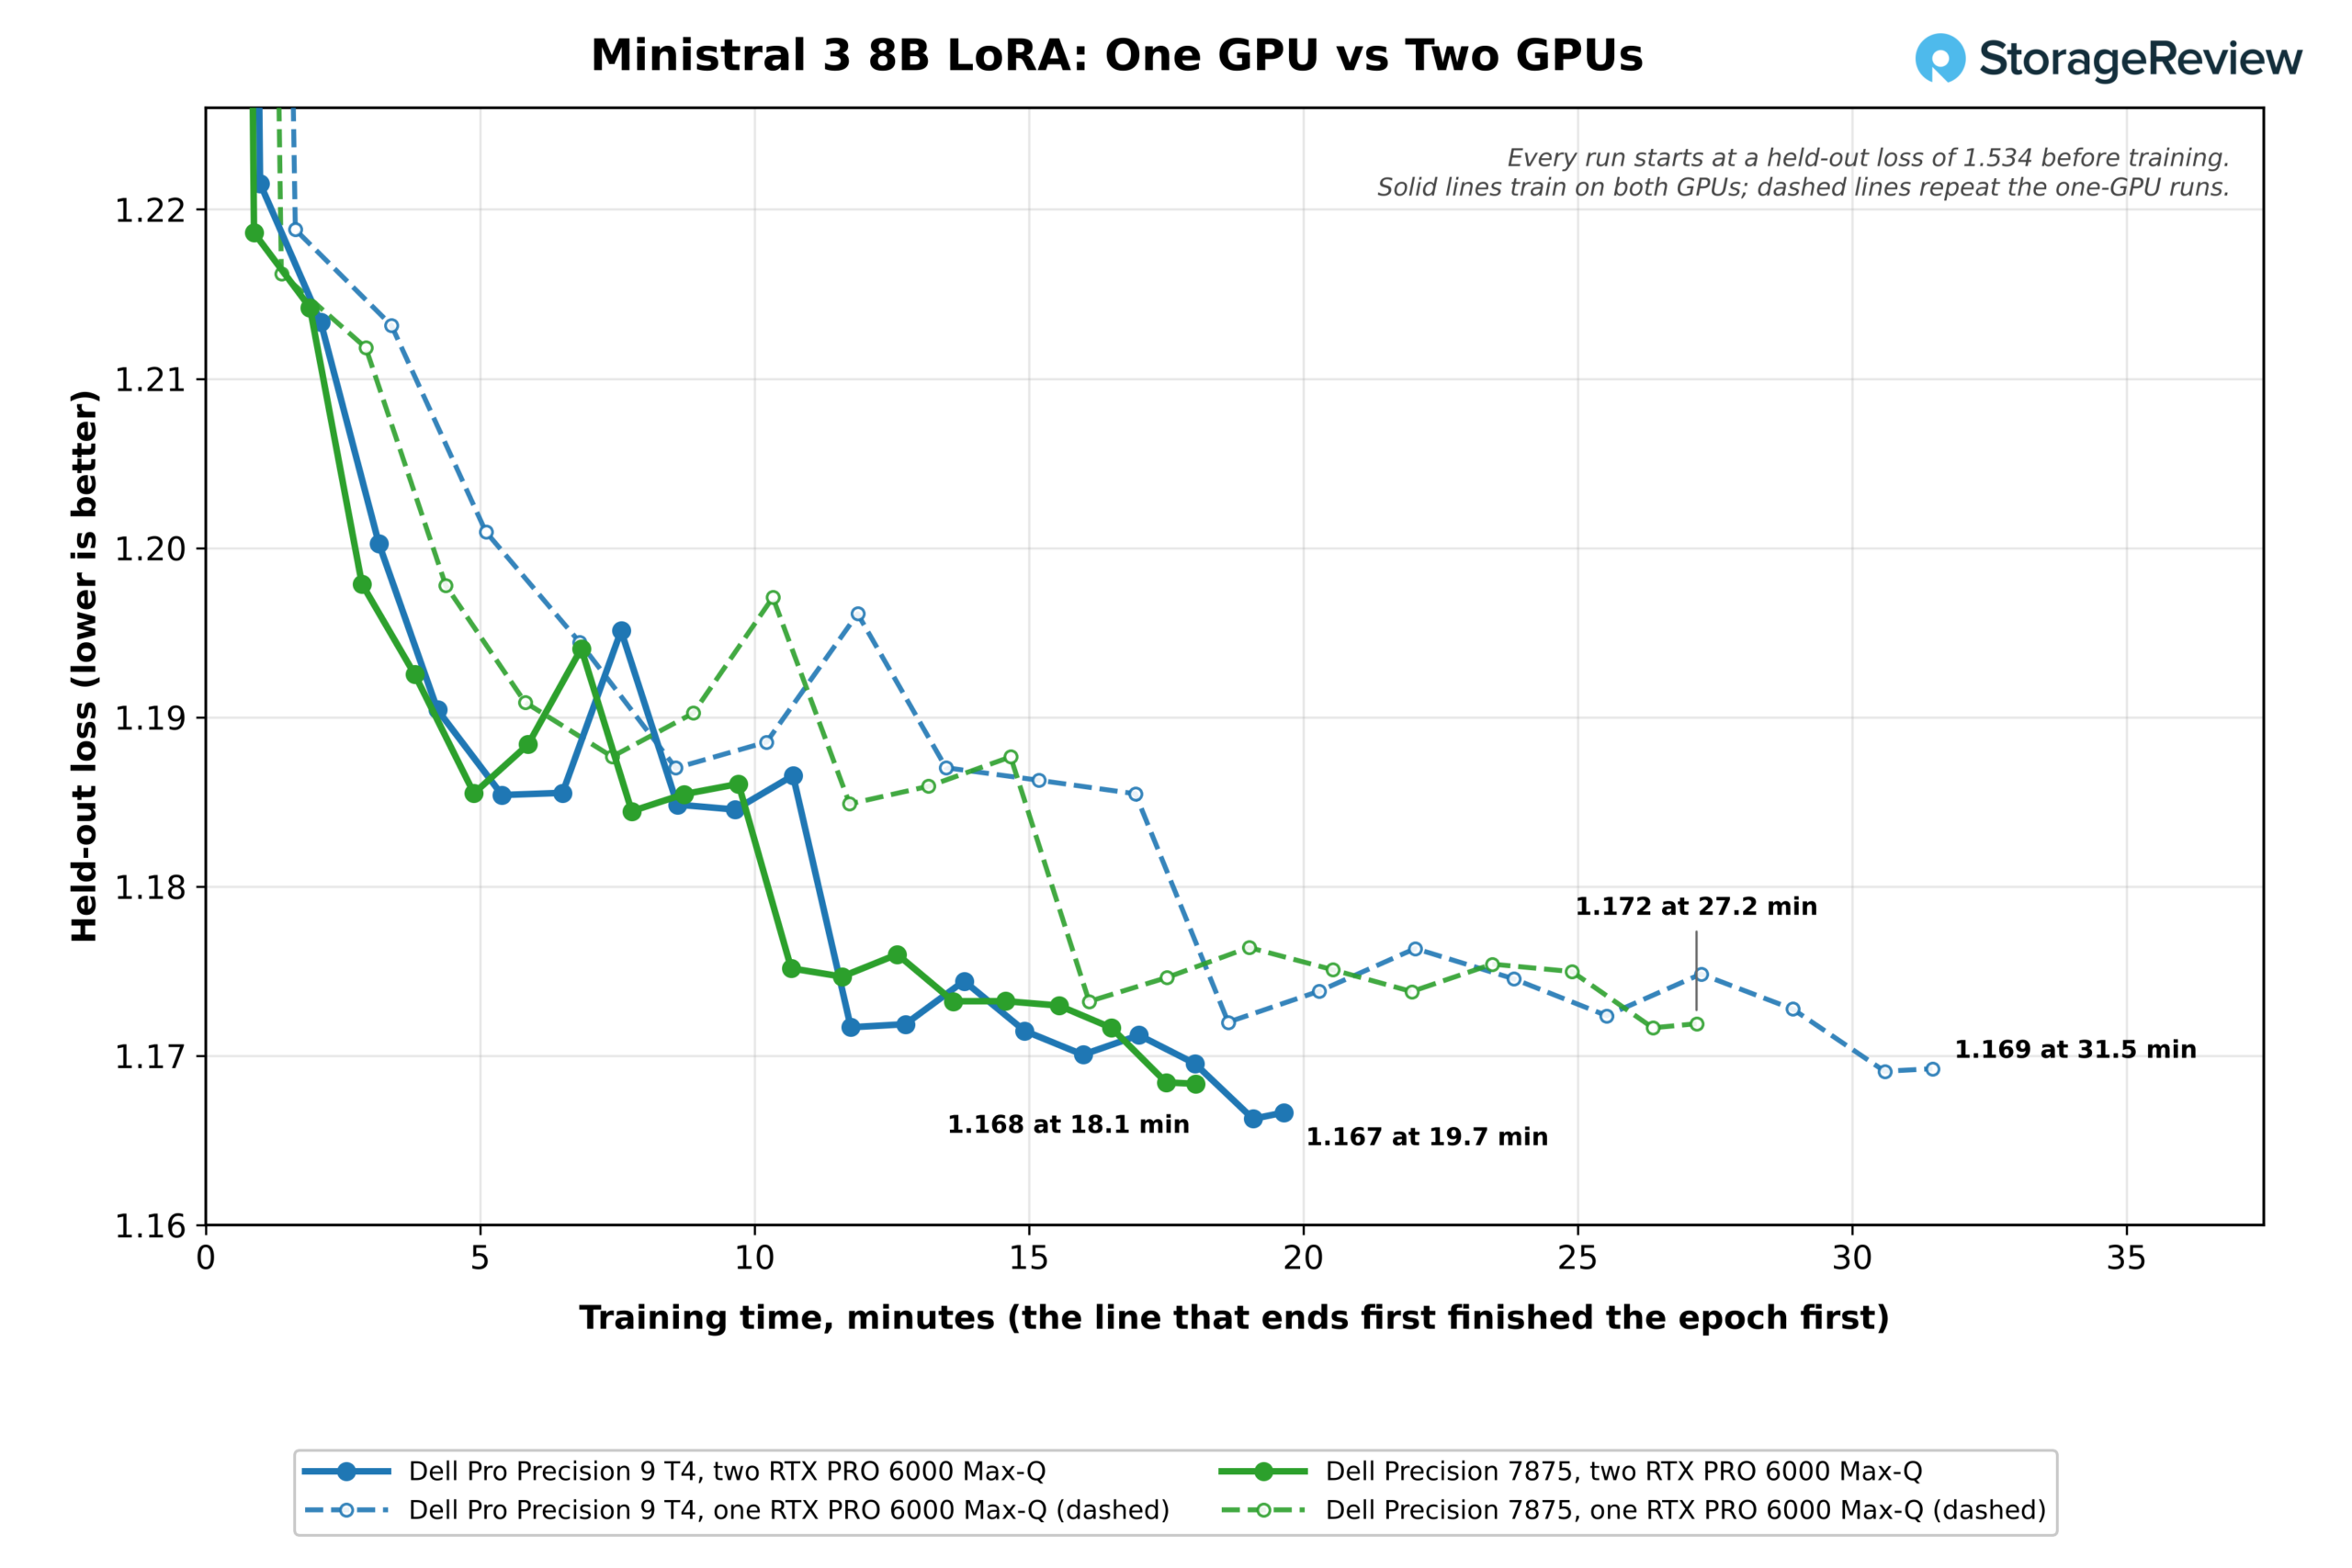
Both cards run data-parallel with two examples per GPU and gradients accumulated to the same global batch of eight, over four passes on one GPU and two passes on a pair, so the two-GPU run sees the same examples at each step and lands on the same loss. With two short examples per GPU in each pass, the second card has little work to absorb and gradient exchange takes a larger share of each step. The epoch peaked at 19.5GiB of GPU memory on one card and 19.7GiB per card on two, a fraction of the 96GB on each RTX PRO 6000.
Coding Agent, Small-Scale RAG, and Image Generation
| Coding agent, RAG, and image generation (higher is better unless noted) | Dell Pro Precision 9 T4 | Dell Precision 7875 | Dell Pro Precision 9 T2 | Dell Pro Max Tower T2 |
|---|---|---|---|---|
| Coding agent, gpt-oss:20b 64K, successful runs (of 3) | 3 | 2* | 2* | 2* |
| Coding agent, gpt-oss:120b 128K, successful runs (of 3) | 3 | 3 | 3 | 3 |
| Coding agent, gpt-oss:120b, generation rate (tokens/s) | 161.5 | 167.9 | 166.7 | 183.2 |
| RAG, 20,963 passages, ingest (passages/s) | 304.6 | 433.8 | 392.1 | 371.6 |
| RAG answer generation, Phi-4-mini (tokens/s) | 372.5 | 410.0 | 402.8 | 415.8 |
| FLUX.2 klein 4B BF16, 1024×1024 (images/min) | 40.96 | 43.03 | 41.32 | 54.25 |
| Z-Image Turbo 6B BF16 (images/min) | 17.29 | 17.67 | 17.27 | 23.83 |
| Qwen-Image 20B BF16 (images/min) | 2.43 | 2.45 | 2.39 | 3.20 |
*Flagged by the suite: one of the three agent runs on this system did not pass all 11 tests.
The T4 passed every coding agent run at every model tier, including all three gpt-oss:20b runs at a 64K context where the other three systems passed two of three, and it generated 161.5 tokens per second on gpt-oss:120b. Image generation runs on one GPU, so the T4’s 40.96 images per minute on FLUX.2 klein in BF16 sits with the other Max-Q systems and behind the 600W card at 54.25.
CPU Performance
The CPU results put the T4’s 86 Xeon cores against the Precision 7875’s 96 Threadripper cores, with the two 24-core T2s as reference points. The Threadripper has ten more cores and brings 192 threads to the Xeon’s 172. The T4 leads where memory bandwidth decides the result, and the 7875 leads where core count and clocks do.
Compression, Rendering, and Compiling
| Test | Dell Pro Precision 9 T4 | Dell Precision 7875 | Dell Pro Precision 9 T2 | Dell Pro Max Tower T2 |
|---|---|---|---|---|
| 7-Zip, all threads (GIPS) | 619.8 | 850.0 | 285.1 | 172.7 |
| 7-Zip, one thread (GIPS) | 8.85 | 10.58 | 9.27 | 11.04 |
| Blender 4.5 Monster (samples/min) | 961.8 | 1,253.8 | 400.7 | 303.0 |
| Blender 4.5 Junkshop (samples/min) | 641.9 | 849.7 | 266.9 | 191.9 |
| Blender 4.5 Classroom (samples/min) | 442.8 | 612.2 | 187.2 | 147.1 |
| HandBrake x265 (fps) | 31.4 | 41.7 | 41.5 | 40.0 |
| HandBrake SVT-AV1 (fps) | 159.4 | 255.8 | 198.5 | 122.6 |
| LLVM 21 build (s, lower is better) | 58.4 | 43.7 | 106.4 | 155.9 |
| Linux kernel allmodconfig (s, lower is better) | 312 | 264 | 537 | 843 |
| OpenSSL AES-256-GCM, all threads (GB/s) | 882.6 | 1,139.1 | 371.2 | 137.0 |
| nginx, 1,000 connections (requests/s) | 414,468 | 467,128 | 323,567 | 153,732 |
The T4 scored 619.8 GIPS in 7-Zip and 961.8 samples per minute in Blender Monster, 2.2 and 2.4 times the 24-core Pro Precision 9 T2. The Precision 7875 ran 37 percent ahead in 7-Zip and 30 percent ahead in Blender, and it finished the LLVM build in 43.7 seconds against 58.4, and the Linux kernel allmodconfig build in 264 seconds against 312. Per-core speed is the T4’s weak point, with the lowest one-thread 7-Zip score in this group at 8.85 GIPS.
HandBrake’s x265 encode is the outlier in this table, and the cause is the encoder more than the processor. The other three systems all landed between 40.0 and 41.7 fps with 24 or 96 cores, so x265 at this preset is not scaling with core count, and the T4’s 31.4 fps is consistent with its lower per-core speed on the threads x265 does use. During the encode the T4 averaged about 1GHz across its 172 threads at 51C to 64C, which shows most of the chip idle. SVT-AV1 scaled better, at 159.4 fps on the T4 against 255.8 on the 7875.


Memory Bandwidth, Simulation, and Math
| Test | Dell Pro Precision 9 T4 | Dell Precision 7875 | Dell Pro Precision 9 T2 | Dell Pro Max Tower T2 |
|---|---|---|---|---|
| STREAM Triad (MB/s) | 328,329 | 215,177 | 141,832 | 45,102 |
| OpenFOAM 13 drivAer, 3M cells, solve (s, lower is better) | 293 | 556 | 826 | Did not finish |
| GROMACS benchPEP, all cores (ns/day) | 1.243 | 1.034 | Not run | Not run |
| GROMACS benchMEM, 16 cores (ns/day) | 68.09 | 84.94 | 78.03 | 54.26 |
| OpenBLAS DGEMM, all cores (GFLOPS) | 3,664 | 4,745 | 2,319 | 1,063 |
| OpenBLAS LU solve N=20000 (GFLOPS) | 1,660 | 1,172 | 1,616 | 858 |
| y-cruncher Pi, 1B digits (s, lower is better) | 4.01 | 7.45 | 8.51 | 24.61 |
| y-cruncher Pi, 10B digits (s, lower is better) | 53.9 | 83.7 | 119.2 | 347.9 |
| y-cruncher Pi, 25B digits (s, lower is better) | 155.6 | 259.6 | Not run | Not run |
Eight channels of DDR5-6400 give the T4 328GB/s in STREAM Triad, 53 percent above the Precision 7875’s DDR5-5600 and 2.3 times the four-channel Pro Precision 9 T2. Bandwidth-bound work follows: the T4 solved the 3-million-cell OpenFOAM drivAer case in 293 seconds against 556 on the 7875 and 826 on the Pro Precision 9 T2, while the Pro Max Tower T2 did not finish within the suite’s 150-minute limit. The T4 also ran the 22.6-million-cell case in 6,851 seconds.

GROMACS benchPEP, the large all-core molecular dynamics case, ran at 1.243 ns/day on the T4 against 1.034 on the 7875, and the LU solve reached 1,660 GFLOPS against 1,172. y-cruncher computed 10 billion digits of Pi in 53.9 seconds against 83.7 on the 7875 and 25 billion in 155.6 seconds against 259.6. Dense compute that stays in cache favors the Threadripper, which led OpenBLAS DGEMM at 4,745 GFLOPS against 3,664.


Databases and Services
| Test | Dell Pro Precision 9 T4 | Dell Precision 7875 | Dell Pro Precision 9 T2 | Dell Pro Max Tower T2 |
|---|---|---|---|---|
| ClickBench hot run, 43 queries (s, lower is better) | 3.21 | 2.88 | 4.80 | 10.44 |
| ClickBench cold run, 43 queries (s, lower is better) | 6.45 | 7.09 | 6.92 | 14.22 |
| Valkey cache, SET (requests/s) | 666,714 | 1,138,696 | 914,832 | 1,719,108 |
| Valkey cache, GET (requests/s) | 865,353 | 1,279,429 | 991,576 | 1,648,278 |
| Stockfish, all threads (Mnps) | 68.21 | 168.27 | 45.44 | 37.42 |
| PyPerformance go (ms, lower is better) | 74.3 | 66.0 | 72.1 | 56.7 |
ClickHouse ran the 43 ClickBench queries in 3.21 seconds hot and 6.45 seconds cold on the T4, 0.33 seconds behind the 7875 on the hot run and 0.64 seconds ahead on the cold run. Valkey favors fast cores over many cores, and the T4’s 666,714 SET requests per second trail all three comparison systems, with the Core Ultra 9 285K in the Pro Max Tower T2 leading at 1.72 million. That pattern matches the T4’s one-thread results and is worth weighing for latency-bound services.
With all 172 threads loaded and the processor at an 87C mean, the T4 searched 68.21 million nodes per second in Stockfish, 1.5 times the 48-thread Pro Precision 9 T2 and well under half of the 7875’s 168.27 on 192 threads. The test also timed out in the T4’s first full run before a standalone retest produced this figure. We report the result as measured and have not isolated the cause of the weak scaling.
Storage Performance
| fio, 25GiB footprint (higher is better) | Dell Pro Precision 9 T4 | Dell Precision 7875 | Dell Pro Precision 9 T2 | Dell Pro Max Tower T2 |
|---|---|---|---|---|
| Sequential read 128K (MB/s) | 14,152 | 7,089 | 20,914* | 7,234 |
| Sequential write 128K (MB/s) | 10,078 | 5,265 | 12,564 | 6,772 |
| Random read 4K, peak (IOPS) | 2,306,346 | 993,569 | 3,214,066 | 1,538,387 |
| Random write 4K, peak (IOPS) | 1,830,776 | 787,388 | 2,353,766 | 1,326,030 |
*Flagged by the suite for run-to-run variance after a rerun.
The T4’s 2TB SK hynix Gen5 boot drive read at 14,152MB/s and wrote at 10,078MB/s, about twice the sequential read of the Gen4 drives in the Precision 7875 and the Pro Max Tower T2, and it peaked at 2.31 million random read IOPS and 1.83 million random write IOPS. The Pro Precision 9 T2’s sequential read of 20,914MB/s exceeds what one Gen5 x4 link carries, which fits that system’s test volume, a striped array of Samsung PM9E1 Gen5 drives. We tested the T4’s boot drive alone, and the second 2TB drive was not part of this run.

Thermals and Clocks Under Load
| Dell Pro Precision 9 T4 | CPU Max (C) | CPU Mean (C) | Mean CPU Clock (MHz) |
|---|---|---|---|
| 7-Zip | 93 | 80.6 | 1,967 |
| Blender | 91 | 85.7 | 2,587 |
| GROMACS | 96 | 81.3 | 1,313 |
| LLVM build | 83 | 74.5 | 2,127 |
| OpenBLAS | 80 | 62.9 | 1,325 |
| LLM serving | 84 | 65.0 | 924 |
| Fine-tuning | 71 | 61.2 | 854 |
| RAG at scale | 74 | 64.4 | 987 |
| Storage | 64 | 55.4 | 942 |
With the BIOS in Ultra Performance mode, the Xeon 698X peaked at 93C in 7-Zip and 96C in GROMACS, and the clock figures in the table are averages across all 172 logical CPUs. Blender and Stockfish load every thread and held 2.5GHz to 2.6GHz, above the chip’s 2.0GHz base. GROMACS and OpenBLAS load 64 and 86 physical cores and leave the remaining threads idle near 0.8GHz, which is why their averages read about 1.3GHz. GPU-led work kept the processor cooler, at a 61C to 65C mean during LLM serving, fine-tuning, and RAG, since those tests lean on the cards.

Conclusion
The Dell Pro Precision 9 T4 is built for local AI work, and the second RTX PRO 6000 is where it shows. Two Max-Q cards raised peak serving throughput 1.85 to 2.02 times across four models and embedding throughput 1.92 times, cut a LoRA epoch on Ministral 3 8B from 31.5 to 19.7 minutes, and turned MiniMax M2.7, a model too large for one card, from 30.3 to 83.7 tokens per second for a single user. On gpt-oss 120B, one server per GPU reached 7,091 total tokens per second at 64 requests, while splitting the model across both cards returned a single user’s first token in 719ms against 1,189ms.

Eight channels of DDR5-6400 gave the Xeon 698X a 53 percent memory bandwidth lead over the Threadripper PRO 9995WX. That bandwidth carried the T4 to faster OpenFOAM, GROMACS benchPEP, y-cruncher, and HNSW search results than the Precision 7875, and the T4’s Gen5 storage loaded large models faster. The chassis deserves credit as well, with the best cooling layout we have seen from Dell in this class and tool-less access to the power supply.
The 7875 remains ahead on core-bound rendering, compression, and compile work by 18 to 38 percent, and by 60 percent in SVT-AV1. The Xeon’s per-core speed trailed every system in this group, which showed in Valkey and other lightly threaded services. Fine-tuning on a single GPU was also slower on the T4, where the LoRA epoch took 31.5 minutes against 27.2 on the 7875 and 22.3 on the 600W card in the Pro Max Tower T2, with every system finishing within 0.005 of the same held-out loss.
At about $66,600 as configured on Dell.com, the T4 suits teams that want to serve, embed, and fine-tune models on premises, including models that need more than 96GB of GPU memory, alongside memory-bound simulation and analytics on the same machine. Buyers whose work is mostly rendering and compilation will find the Threadripper platform faster, and buyers who need one GPU can get the same card in the smaller Pro Precision 9 T2.

Leaderboard: The Dell Pro Precision 9 T4 holds Best Xeon Tower for Local AI on our Best Desktops for Local AI leaderboard.


 Amazon