

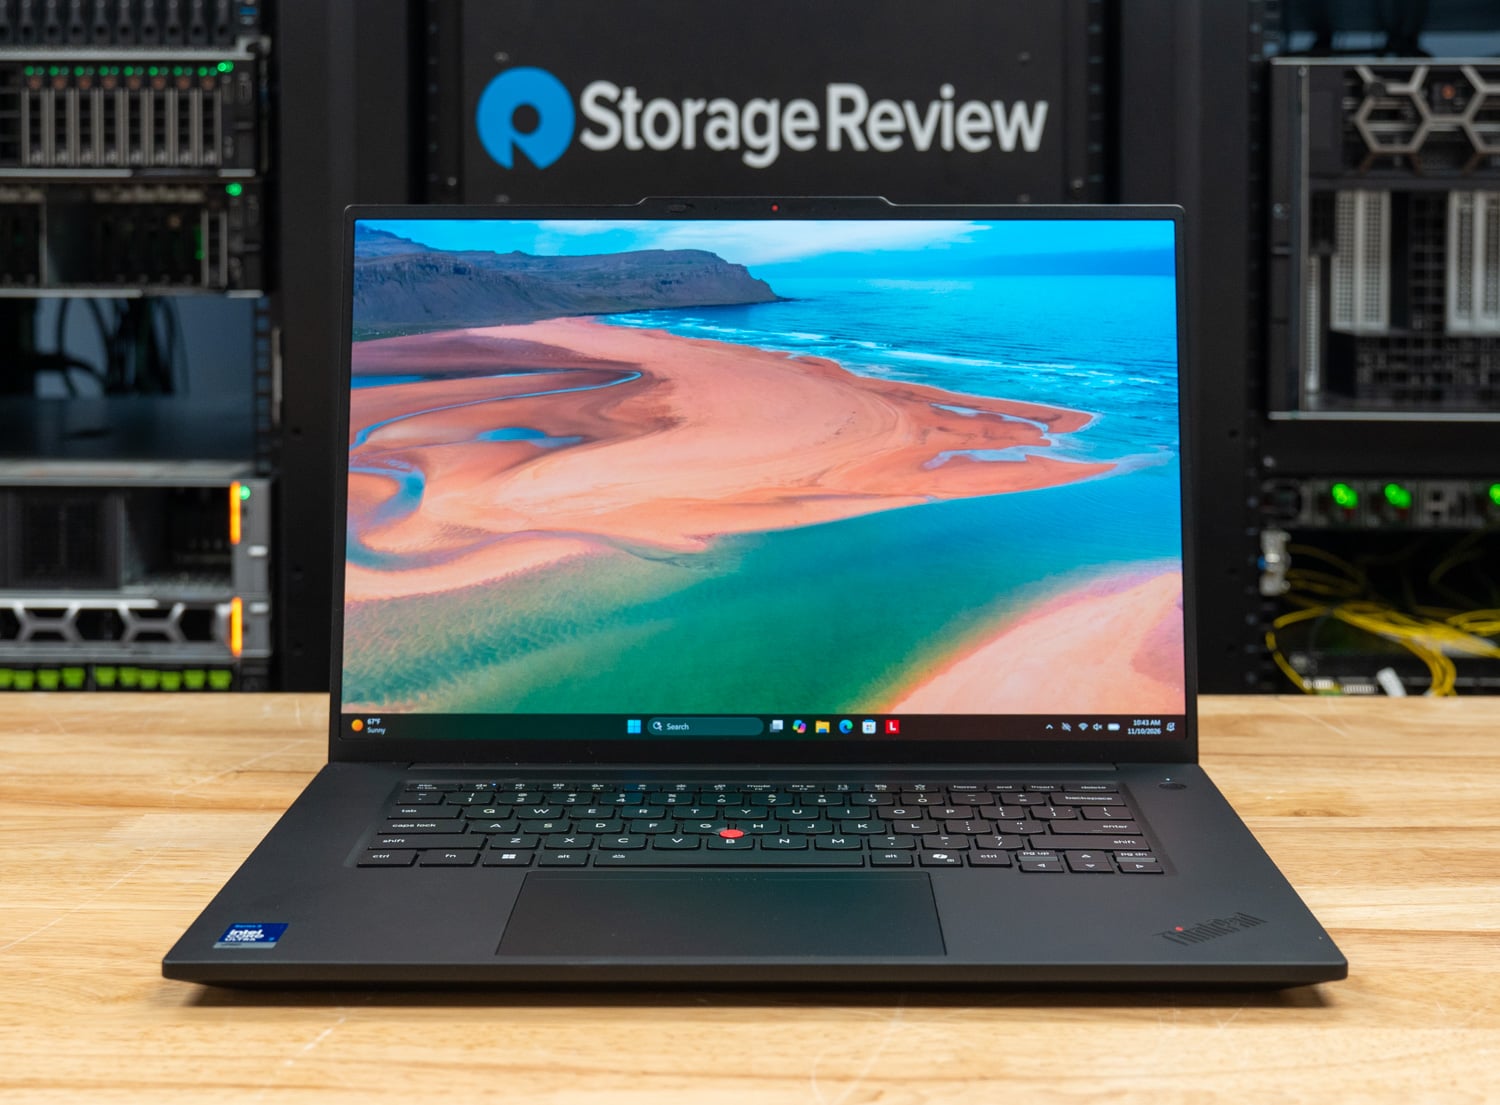
The Lenovo ThinkPad T1g Gen 9 pairs a business ThinkPad with a consumer graphics card. It is a 16-inch aluminum notebook with Intel vPro, MIL-STD-810H testing, a discrete TPM, and a TrackPoint. Its top graphics option is the GeForce RTX 5070 Laptop GPU with 12GB of memory, whereas a mobile workstation would carry an RTX PRO variant. Lenovo targets creative professionals and engineers who want ThinkPad durability with a strong GPU, and its materials make no mention of gaming. Our review unit runs the Core Ultra 7 366H with 64GB of LPCAMM2 memory, a 2TB Gen5 SSD, and the 3.2K tandem OLED touch panel.
Key Takeaways
- A consumer GPU in a business ThinkPad, pitched at creators. The T1g Gen 9 keeps vPro, a discrete TPM, and MIL-STD-810H testing, and swaps workstation graphics for GeForce, topping out at the RTX 5070 with 12GB. Lenovo names creative professionals and engineers as the audience and makes no ISV certification or gaming claim.
- 12GB of GPU memory is the gain over the P1 Gen 9. The T1g served the Ministral 3 8B model at 49.9 tokens per second and generated FLUX.2 klein images at 9.36 per minute. The P1 Gen 9 with the 8GB RTX PRO 2000 could not load either, and the two finished within 2 percent of each other in MLPerf Client.
- The Core Ultra 7 366H lands 3 percent behind the Core Ultra 9. Cinebench 2026 multi core reached 4,928 against 5,083 for the 386H in the P1, and the T1g held 99.5 percent of its first pass through a 30-minute loop. The N1X laptops lead multi-core work by 35 to 42 percent.
- Larger local models remain out of reach. The RTX 5070 measured 11.7GB usable, under the 16GB floor for our model load and coding agent tests, so those did not run. The N1X systems and a 24GB RTX 5090 notebook clear that floor.
- Fast sequential storage with weaker random results. The 2TB Micron Gen5 SSD read at 13,525MB/s and wrote at 9,238MB/s. At QD32 across four jobs it trailed the P1 by 23 percent on 4K random read and 31 percent on random write.
- $5,349 as tested, with one cheaper model in stock. Our configuration is listed on Lenovo.com as available soon. The in-stock model pairs the same processor with the RTX 5060 and a 3840×2400 IPS panel at $3,839.
Where the T1g Gen 9 Sits
The T1g Gen 9 shares its platform with the ThinkPad P1 Gen 9, Lenovo’s thin flagship mobile workstation. The two use the same BIOS family and share a 9.87mm front edge, a 90Wh battery, 140W USB-C charging, two Thunderbolt 5 ports, a third Thunderbolt 4 port, dual M.2 slots, and support for up to 96GB of LPCAMM2 memory. The key difference is the graphics hardware and driver certification: the P1 tops out at the 8GB RTX PRO 2000 Blackwell with ISV-certified drivers, while the T1g offers either the 8GB GeForce RTX 5060 or the 12GB GeForce RTX 5070.
That swap is the decision buyers have to weigh, because GeForce hardware gives the T1g 50 percent more GPU memory than any P1 configuration, and in our testing that memory decided which AI workloads would load at all. What the T1g gives up is workstation certification: Lenovo makes no ISV claim for it, so applications that require certified drivers for vendor support remain P1 territory. That leaves the T1g with the P1’s audience minus the certification requirement.
Lenovo does not pitch the T1g as a gaming notebook, though the parts list supports that use after hours. The RTX 5070 sits behind a 3.2K tandem OLED panel with a 40 to 120Hz variable refresh rate and 1,500 nits of HDR peak brightness, and HDMI 2.1 is on the chassis for an external display. The chassis is still a ThinkPad with a six-row keyboard and a 5MP conferencing camera, so the fair description is a managed business notebook that can also render, run small local AI models, and play games on one GPU. Our suite includes a single game test, covered below.
Lenovo sells the T1g with the Core Ultra 7 356H, Core Ultra 7 366H, or Core Ultra 9 386H, and with three 16-inch panels: a 500-nit WUXGA IPS, an 800-nit 3840×2400 IPS, and the tandem OLED. Our configuration, model 21UG000BUS, is listed at $5,349 on Lenovo.com and shown as available soon. The same build with the Core Ultra 9 386H is $5,449. The one model in stock at the time of writing is a Core Ultra 7 366H with the RTX 5060, 64GB, 2TB, and the 3840×2400 IPS panel at $3,839, which puts a $1,510 premium on the RTX 5070 and OLED together.
Build and Design
The T1g Gen 9 uses aluminum for the top and bottom covers and measures 354.4 x 241.2mm, tapering from 9.87mm at the front to 15.8mm at the rear, with a starting weight of 1.84kg (4.06lb). Lenovo tests the chassis against 12 MIL-STD-810H methods and more than 20 procedures. The look is conventional ThinkPad black, with the fingerprint reader built into the power button and a Kensington Nano lock slot for physical security.
In hand, the T1g bridges the look and feel of a business notebook with the hardware of a consumer gaming GPU. Buyers who prefer a professional design get ThinkPad staples: the signature keyboard, a haptic touchpad, and the TrackPoint. The main body carries the slightly rubbery ThinkPad soft-touch finish, the top cover is matte black metal, and the ThinkPad logo on the lid has the lit dot over the i.

Port selection matches the P1: two Thunderbolt 5 ports and one Thunderbolt 4, each with DisplayPort 2.1 and USB PD 3.1 at up to 140W input, one USB-A at 10Gbps with always-on charging, HDMI 2.1 with 8K at 60Hz output, a 3.5mm combo jack, and an SD Express 7.0 card reader. Wireless is Intel Wi-Fi 7 BE211 with Bluetooth 5.4.
The left side carries HDMI 2.1, two of the Thunderbolt ports, and the 3.5mm combo jack, and the right side has the SD Express 7.0 reader, the third Thunderbolt port, USB-A, and the Kensington Nano lock slot. The system drives up to four displays, counting the internal panel, across the Thunderbolt and HDMI outputs.


The keyboard is the six-row, spill-resistant ThinkPad layout with a backlight and the TrackPoint, and the touchpad is new this generation: a glass-surface haptic pad measuring 85 x 135mm. Above the display, a 5MP camera with an IR sensor handles Windows Hello and human presence detection behind a physical privacy shutter. Audio comes from two 2W bottom-firing speakers with Dolby Atmos tuning and a dual far-field microphone array with Dolby Voice.

Our unit’s panel is the 16-inch, 16:10 tandem OLED at 3200×2000 with touch, rated for 600 nits in SDR and 1,500 nits at HDR peak, 100 percent DCI-P3 coverage, DisplayHDR 600, Dolby Vision, and a 40 to 120Hz variable refresh rate. Lenovo’s guidance is that the WUXGA IPS panel offers the longest battery life, while the OLED trades runtime for image quality. We have not measured battery life or panel output yet.

Memory is a single LPCAMM2 module, which packages LPDDR5X-8533 on a board that screws to the motherboard, so the 64GB in our unit can be replaced or upgraded to the 96GB maximum. Storage sits in two M.2 2280 slots, both PCIe Gen5, with up to 8TB supported across the pair. The battery is a 90Wh pack with Rapid Charge to 80 percent in one hour.
The bottom cover comes off easily, and with it removed, two fans flank a shared set of heat pipes over the CPU and GPU, and the LPCAMM2 module sits under a labeled cover that prints the screw-tightening sequence for reinstalling it. The M.2 bays sit under heat spreaders on either side, and the 90Wh battery spans the front edge with a speaker at each corner.

Lenovo ThinkPad T1g Gen 9 Specifications
| Specification | Lenovo ThinkPad T1g Gen 9 (as tested) |
|---|---|
| Platform | |
| Model | 21UG000BUS |
| Processor | Intel Core Ultra 7 366H vPro, 16 cores (4 P-cores, 8 E-cores, 4 LP E-cores), P-cores up to 4.8GHz |
| NPU | Up to 50 TOPS |
| Graphics | NVIDIA GeForce RTX 5070 Laptop GPU, 12GB GDDR7 Intel Graphics (integrated) |
| Memory | 64GB LPDDR5X-8533 (1x 64GB LPCAMM2) Up to 96GB |
| Storage | 2TB M.2 2280 PCIe Gen5 TLC Opal SSD (Micron) 2x M.2 2280 Gen5 slots, up to 8TB |
| Operating System | Windows 11 Pro |
| Display | |
| Panel | 16-inch 16:10 3.2K (3200×2000) tandem OLED, touch |
| Brightness | 600 nits SDR 1,500 nits HDR peak |
| Color and Refresh | 100% DCI-P3 40 to 120Hz VRR DisplayHDR 600, Dolby Vision |
| Other Panel Options | WQUXGA (3840×2400) IPS, 800 nits, 60Hz WUXGA (1920×1200) IPS, 500 nits, 60Hz |
| Connectivity | |
| Ports | 2x Thunderbolt 5 (USB PD 3.1, DisplayPort 2.1) 1x Thunderbolt 4 1x USB-A 10Gbps, always on 1x HDMI 2.1 1x 3.5mm combo jack 1x SD Express 7.0 reader |
| Wireless | Intel Wi-Fi 7 BE211 2×2 Bluetooth 5.4 |
| Input and Audio | |
| Camera | 5MP with IR, privacy shutter, human presence detection |
| Keyboard and Pointing | Six-row backlit, spill-resistant keyboard TrackPoint 85 x 135mm glass haptic touchpad |
| Audio | 2x 2W speakers, Dolby Atmos Dual far-field microphones, Dolby Voice |
| Security and Durability | |
| Security | Discrete TPM 2.0 Match-on-chip fingerprint reader in the power button Kensington Nano Security Slot Self-healing BIOS |
| Durability | MIL-STD-810H |
| Power and Physical | |
| Battery | 90Wh, Rapid Charge to 80% in 1 hour |
| Charging | USB-C, up to 140W |
| Dimensions | 354.4 x 241.2 x 9.87 to 15.8mm (13.95 x 9.50 x 0.39 to 0.62in) |
| Weight | Starting at 1.84kg (4.06lb) |
| Materials | Aluminum top and bottom covers |
| Warranty | 1-year courier or carry-in |
| Price as Tested | $5,349 (Lenovo.com) |
Test Setup and Methodology
Our review unit pairs the Core Ultra 7 366H with the GeForce RTX 5070 Laptop GPU, 64GB of LPDDR5X-8533 memory, and a 2TB Gen5 SSD running Windows 11 Pro. We ran the benchmarks while plugged in, with Windows set to Best performance, the same power mode settings as the P1 Gen 9, and the system on its hybrid graphics setting, on BIOS 1.10 and NVIDIA driver 597.01. Battery life will follow in a later update.
Results come from full, Peak-profile runs of sr-client, our scripted client benchmark suite. The T1g ran version 1.13, the P1 ran version 1.3, and the other comparison systems ran version 1.11; the benchmark applications match across those releases, including Cinebench 2026, 7-Zip 24.09, Blender 4.5, Stockfish 19, GROMACS 2025.3, and MLPerf Client v2.0.
The suite applies the same settings everywhere: Windows power mode at Best performance, display at 50 percent brightness, all sleep and display timers off, Windows Firewall and UAC prompts off, and VBS and Memory Integrity left on as shipped. Each result is the median of repeated passes, and the suite reruns a test if its spread exceeds 2 percent before accepting it.
The comparison set starts with the ThinkPad P1 Gen 9, which is the same platform with the Core Ultra 9 386H and the 8GB RTX PRO 2000, so it isolates the GPU swap and the one-step CPU difference. The Dell Pro Precision 5 16S carries the Core Ultra X9 388H with integrated Arc Pro B390 graphics and no discrete GPU, which makes it a CPU reference for the same Intel generation.
The Razer Blade 16 with the Ryzen AI 9 HX 370 and a 24GB GeForce RTX 5090 marks the ceiling for GeForce in a 16-inch notebook. The Dell XPS 16 Creator Edition and HP OmniBook Ultra 16 run NVIDIA’s 20-core RTX Spark N1X with 64GB and 128GB of unified memory.
| Configuration | CPU | Memory | GPU | Boot Drive | sr-client |
|---|---|---|---|---|---|
| Lenovo ThinkPad T1g Gen 9 (21UG000BUS) | Core Ultra 7 366H, 16 cores | 64GB LPDDR5X-8533 | GeForce RTX 5070 Laptop, 11.7GB usable | 2TB Micron, PCIe Gen5 | 1.13 |
| Lenovo ThinkPad P1 Gen 9 (21UE000XUS) | Core Ultra 9 386H, 16 cores | 64GB LPDDR5X-8533 | RTX PRO 2000 Blackwell, 7.7GB usable | 2TB SK hynix, PCIe Gen5 | 1.3 |
| Dell Pro Precision 5 16S (PW516260) | Core Ultra X9 388H, 16 cores | 64GB LPDDR5X-8533 | Arc Pro B390 (integrated), 47.6GB shared | 1TB SK hynix, PCIe Gen5 | 1.11 |
| Razer Blade 16 (RZ09-0528) | Ryzen AI 9 HX 370, 12 cores | 32GB LPDDR5X-8000 | GeForce RTX 5090 Laptop, 23.6GB usable | 2TB Samsung, PCIe Gen4 | 1.11 |
| Dell XPS 16 Creator Edition (DX16263) | RTX Spark N1X, 20 cores | 64GB LPDDR5X-9400 | N1X integrated RTX, 30.5GB usable | 1TB SK hynix, PCIe Gen4 | 1.11 |
| HP OmniBook Ultra 16 (16-bk0xxx) | RTX Spark N1X, 20 cores | 128GB LPDDR5X-9400 | N1X integrated RTX, 62.5GB usable | 2TB Sandisk, PCIe Gen5 | 1.11 |
Local AI Performance
The T1g’s RTX 5070 measured 11.7GB of usable GPU memory. Our tiered tests start at 16GB, so model loading, the coding agent, and the agent-beside-browser test did not run. That’s the same outcome as the P1 with its 7.7GB. The tests that scale down did run, and they show where 12GB separates the T1g from its sibling: the 8B serving model and FLUX.2 image generation both loaded on the T1g and would not fit on the P1. The N1X systems and the 24GB Blade 16 clear the 16GB floor and run the larger models.
MLPerf Client v2.0
| MLPerf Client v2.0 | Lenovo ThinkPad T1g Gen 9 (366H, RTX 5070 12GB) | Lenovo ThinkPad P1 Gen 9 (386H, RTX PRO 2000 8GB) | Dell Pro Precision 5 16S (X9 388H, Arc Pro B390) | Razer Blade 16 (HX 370, RTX 5090 24GB) | Dell XPS 16 Creator Edition (N1X, 64GB) | HP OmniBook Ultra 16 (N1X, 128GB) |
|---|---|---|---|---|---|---|
| Llama 3.1 8B, time to first token (s, lower is better) | 0.31 | 0.34 | 0.21 | 0.15 | 0.31 | 0.28 |
| Llama 3.1 8B, token rate (tokens/s) | 66.2 | 64.8 | 26.9 | 128.7 | 55.7 | 56.5 |
| Phi-4-mini, time to first token (s, lower is better) | 0.14 | 0.16 | 0.18 | 0.07 | 0.14 | 0.13 |
| Phi-4-mini, token rate (tokens/s) | 114.1 | 111.9 | 41.5 | 215.8 | 96.2 | 97.0 |
MLPerf Client runs through llama.cpp with CUDA on the NVIDIA systems and through OpenVINO on the Precision’s Arc Pro B390, so the Precision column compares engines as well as hardware. The T1g generated 66.2 tokens per second on Llama 3.1 8B and 114.1 on Phi-4-mini, 2 percent ahead of the P1’s RTX PRO 2000 on both and 17 to 19 percent ahead of the N1X laptops. Time to first token matched the XPS 16 at 0.31 seconds on Llama. The Blade 16’s RTX 5090 roughly doubles the T1g at 128.7 and 215.8 tokens per second.

RAG and LLM Serving
| RAG (Ollama 0.40.3) | Lenovo ThinkPad T1g Gen 9 (366H, RTX 5070 12GB) | Lenovo ThinkPad P1 Gen 9 (386H, RTX PRO 2000 8GB) | Dell Pro Precision 5 16S (X9 388H, Arc Pro B390) | Razer Blade 16 (HX 370, RTX 5090 24GB) | Dell XPS 16 Creator Edition (N1X, 64GB) | HP OmniBook Ultra 16 (N1X, 128GB) |
|---|---|---|---|---|---|---|
| Ingest, passages per second | 159.8 | 165.1 | 81.4 | 176.2 | 104.4 | 111.5 |
| Ingest, embedding rate (tokens/s) | 25,883 | 26,740 | 13,188 | 28,541 | 16,901 | 18,049 |
| Answer, generation rate (tokens/s) | 110.0 | 103.5 | 48.4 | 210.0 | 95.0 | 103.4 |
| Answer, time to first token p50 (s, lower is better) | 0.18 | 0.21 | 0.86 | 0.11 | 0.17 | 0.15 |
| Question to answer p50 (s, lower is better) | 0.25 | 0.29 | 0.99 | 0.16 | 0.25 | 0.23 |
The RAG test embeds 20,963 SQuAD passages, retrieves the top five for each question, and answers with Phi-4-mini through Ollama. The T1g ingested 159.8 passages per second and generated answers at 110.0 tokens per second, with a median of 0.25 seconds from question to answer. The P1 is 3 percent quicker on ingest (165.1) and 6 percent slower on generation, and the N1X systems trail the T1g by 30 to 35 percent on ingest.
| llama.cpp server, Ministral 3 | Lenovo ThinkPad T1g Gen 9 (366H, RTX 5070 12GB) | Lenovo ThinkPad P1 Gen 9 (386H, RTX PRO 2000 8GB) | Dell Pro Precision 5 16S (X9 388H, Arc Pro B390) | Razer Blade 16 (HX 370, RTX 5090 24GB) | Dell XPS 16 Creator Edition (N1X, 64GB) | HP OmniBook Ultra 16 (N1X, 128GB) |
|---|---|---|---|---|---|---|
| Ministral 3 3B, 1 request, output (tokens/s) | 69.0 | 67.0 | 22.4 | 130.9 | 57.8 | 57.5 |
| Ministral 3 3B, 4 requests, output (tokens/s) | 176.4 | 168.3 | 38.2 | 342.7 | 146.4 | 148.8 |
| Ministral 3 3B, 1 request, time to first token (ms, lower is better) | 726 | 890 | 4,437 | 383 | 669 | 607 |
| Ministral 3 8B, 1 request, output (tokens/s) | 49.9 | Did not fit | 15.5 | 92.6 | 40.6 | 41.5 |
| Ministral 3 8B, 4 requests, output (tokens/s) | 107.8 | Did not fit | 24.5 | 209.3 | 96.3 | 104.1 |
| Ministral 3 8B, 1 request, time to first token (ms, lower is better) | 1,698 | Did not fit | 10,342 | 843 | 1,794 | 1,554 |
LLM serving runs the llama.cpp server with Ministral 3 models at 4,096 prompt tokens and 1,024 output tokens per request. On the 3B model, the T1g delivered 69.0 tokens per second to one user and 176.4 across four concurrent requests, 3 to 5 percent ahead of the P1. The 8B model is where the two ThinkPads part ways: it needs 11GB of GPU memory, so the T1g served it at 49.9 tokens per second for one request and 107.8 across four, and the P1 could not load it. The T1g also edges the N1X laptops on the 8B model at both concurrency levels shown.

Image Generation
| stable-diffusion.cpp, 1024×1024 | Lenovo ThinkPad T1g Gen 9 (366H, RTX 5070 12GB) | Lenovo ThinkPad P1 Gen 9 (386H, RTX PRO 2000 8GB) | Dell Pro Precision 5 16S (X9 388H, Arc Pro B390) | Razer Blade 16 (HX 370, RTX 5090 24GB) | Dell XPS 16 Creator Edition (N1X, 64GB) | HP OmniBook Ultra 16 (N1X, 128GB) |
|---|---|---|---|---|---|---|
| FLUX.2 klein 4B Q4_0, images per minute | 9.36 | Did not fit | 0.38 | 20.02 | 11.17 | 11.01 |
| FLUX.2 klein 4B Q4_0, time per image (s, lower is better) | 6.41 | Did not fit | 159.85 | 3.00 | 5.37 | 5.45 |
Image generation uses stable-diffusion.cpp at 1024×1024, and only the smallest configuration fit: FLUX.2 klein 4B at Q4_0 used 6.43GiB for weights and produced 9.36 images per minute (6.41 seconds per image). The Q8_0 build needs 13GB, and the larger Z-Image and Qwen-Image models need more, so they did not run. The N1X laptops are 18 to 19 percent faster on the same workload, at about 11 images per minute, and can run the larger models; the Blade 16 reaches 20.02. The P1 could not load FLUX.2 at all, and the Precision’s integrated graphics managed 0.38 images per minute.
CPU Performance
Cinebench 2026 and Sustained Load
| Cinebench 2026 (points, higher is better) | Lenovo ThinkPad T1g Gen 9 (366H, RTX 5070 12GB) | Lenovo ThinkPad P1 Gen 9 (386H, RTX PRO 2000 8GB) | Dell Pro Precision 5 16S (X9 388H, Arc Pro B390) | Razer Blade 16 (HX 370, RTX 5090 24GB) | Dell XPS 16 Creator Edition (N1X, 64GB) | HP OmniBook Ultra 16 (N1X, 128GB) |
|---|---|---|---|---|---|---|
| Single core | 510 | 520 | 535 | 481 | 565 | 561 |
| Multi core | 4,928 | 5,083 | 4,754 | 5,201 | 6,631 | 7,001 |
| 30-minute loop, first pass | 4,924 | 4,894 | 4,634 | 5,181 | 6,539 | 7,014 |
| 30-minute loop, steady state | 4,901 | 4,811 | 4,413 | 5,218 | 6,550 | 6,970 |
| Steady state / first pass | 0.995 | 0.983 | 0.952 | 1.007 | 1.002 | 0.994 |
The Core Ultra 7 366H scored 4,928 in Cinebench 2026 multi-core and 510 in single-core. That is 3 percent behind the Core Ultra 9 386H in the P1 on multi-core and 2 percent behind on single-core, and the single-core gap lines up with the 100MHz difference in rated P-core turbo between the two chips. It finishes 4 percent ahead of the Precision’s X9 388H and 5 percent behind the Blade 16’s Ryzen AI 9 HX 370. The N1X systems are substantially faster in multi-threaded work: the XPS 16 scored 6,631 and the OmniBook scored 7,001, outperforming the T1g by 35 and 42 percent, respectively.
Over the 30-minute loop, which matters more in a 15.8mm chassis, the T1g opened at 4,924 and settled at 4,901, holding 99.5 percent of its first pass with the CPU at a mean 92.9C and a mean clock of 3,576MHz. The P1 held 98.3 percent and the Precision 95.2 percent in the same test, so the T1g’s cooling keeps the 366H closer to its opening score than either.

7-Zip, Blender, HandBrake, and LLVM
| Test | Lenovo ThinkPad T1g Gen 9 (366H, RTX 5070 12GB) | Lenovo ThinkPad P1 Gen 9 (386H, RTX PRO 2000 8GB) | Dell Pro Precision 5 16S (X9 388H, Arc Pro B390) | Razer Blade 16 (HX 370, RTX 5090 24GB) | Dell XPS 16 Creator Edition (N1X, 64GB) | HP OmniBook Ultra 16 (N1X, 128GB) |
|---|---|---|---|---|---|---|
| 7-Zip, all threads, total (GIPS) | 106.7 | 109.2 | 108.3 | 126.2 | 147.0 | 150.6 |
| 7-Zip, one thread, total (GIPS) | 9.35 | 9.49 | 9.86 | 9.26 | 9.13 | 9.10 |
| Blender 4.5 Monster (samples/min) | 130.7 | 135.4 | 129.1 | 142.4 | 198.9 | 211.4 |
| Blender 4.5 Junkshop (samples/min) | 89.9 | 92.8 | 88.9 | 99.2 | 119.1 | 127.7 |
| Blender 4.5 Classroom (samples/min) | 64.7 | 66.8 | 62.8 | 79.1 | 86.7 | 92.8 |
| HandBrake x265 (fps) | 28.8 | 30.3 | 29.6 | 33.9 | 38.8 | 40.6 |
| HandBrake SVT-AV1 (fps) | 81.6 | 84.5 | 81.7 | 77.0 | 14.0 | 15.4 |
| LLVM build (s, lower is better) | 348 | 309 | 349 | 351 | 232 | 218 |
Across the content creation tests, the T1g trails the P1 by 2 to 5 percent: 106.7 against 109.2 GIPS in 7-Zip, 130.7 against 135.4 samples per minute in Blender Monster, and 28.8 against 30.3 fps in x265. The LLVM build is the exception at 348 seconds against 309, a 13 percent gap that is wider than the processor difference explains. Both ThinkPads ran with the same power mode settings, so we report the result as measured.
The N1X systems lead most rows in this group by wide margins, including 52 to 62 percent in Blender Monster and a 218 to 232 second LLVM build, with SVT-AV1 as the exception: the T1g encoded at 81.6 fps against 14.0 and 15.4 fps on the two Arm laptops. Among the x86 systems, the Blade 16’s 24-thread Ryzen leads 7-Zip at 126.2 GIPS and trails all three Intel machines in SVT-AV1.


Stockfish, primesieve, Python, and the Browser
| Test | Lenovo ThinkPad T1g Gen 9 (366H, RTX 5070 12GB) | Lenovo ThinkPad P1 Gen 9 (386H, RTX PRO 2000 8GB) | Dell Pro Precision 5 16S (X9 388H, Arc Pro B390) | Razer Blade 16 (HX 370, RTX 5090 24GB) | Dell XPS 16 Creator Edition (N1X, 64GB) | HP OmniBook Ultra 16 (N1X, 128GB) |
|---|---|---|---|---|---|---|
| Stockfish, one thread (Mnps) | 1.73 | 1.76 | 1.86 | 2.02 | 1.74 | 1.73 |
| Stockfish, all threads (Mnps) | 14.96 | 15.30 | 15.02 | 18.44 | 13.87 | 15.19 |
| primesieve to 10^12, all threads (s, lower is better) | 11.98 | 11.10 | 11.34 | 10.63 | 10.39 | 9.53 |
| primesieve to 10^11, one thread (s, lower is better) | 10.39 | 10.15 | 9.55 | 6.63 | 12.03 | 12.02 |
| PyPerformance go (ms, lower is better) | 75.7 | 75.5 | 69.6 | 75.9 | 111.6 | 111.2 |
| PyPerformance nbody (ms, lower is better) | 57.6 | 58.7 | 52.4 | 61.6 | 80.8 | 80.4 |
| Speedometer 3.1 (score) | 40.9 | 40.6 | 42.9 | 38.8 | 36.5 | 34.8 |
Single-threaded results put the T1g level with the P1, at 1.73 Mnps in one-thread Stockfish, 75.7ms in PyPerformance go, and 40.9 in Speedometer 3.1, each within 2 percent of its sibling. The Precision’s X9 388H runs 7 to 8 percent ahead of both in one-thread Stockfish and PyPerformance go. The T1g leads the N1X laptops in the browser, 40.9 against 36.5 and 34.8, and in the Python tests, where the Arm systems take 40 to 47 percent longer. The Blade 16’s Zen 5 cores are strongest on one-thread primesieve at 6.63 seconds against the T1g’s 10.39.
GROMACS, OpenBLAS, and Memory
| Test | Lenovo ThinkPad T1g Gen 9 (366H, RTX 5070 12GB) | Lenovo ThinkPad P1 Gen 9 (386H, RTX PRO 2000 8GB) | Dell Pro Precision 5 16S (X9 388H, Arc Pro B390) | Razer Blade 16 (HX 370, RTX 5090 24GB) | Dell XPS 16 Creator Edition (N1X, 64GB) | HP OmniBook Ultra 16 (N1X, 128GB) |
|---|---|---|---|---|---|---|
| GROMACS benchMEM (ns/day) | 24.98 | 24.07 | 23.28 | 26.85 | 17.41 | 17.48 |
| OpenBLAS DGEMM, all cores (GFLOPS) | 506.1 | 518.5 | 527.5 | 454.4 | 354.6 | 374.0 |
| OpenBLAS LU solve N=20000, all cores (GFLOPS) | 441.0 | 474.2 | 503.5 | 460.8 | 314.9 | 321.9 |
| STREAM Triad (MB/s) | 81,548 | 81,712 | 83,038 | 48,248 | 122,872 | 120,783 |
| Memory latency, 4KiB pages (ns, lower is better) | 117.2 | 116.1 | 115.2 | 129.5 | 140.5 | 143.6 |
The floating-point tests favor the x86 systems: the T1g ran GROMACS benchMEM at 24.98 ns/day, 4 percent ahead of the P1 and 43 percent ahead of the N1X laptops, and reached 506.1 GFLOPS in OpenBLAS DGEMM against 354.6 and 374.0 on the Arm systems. Memory bandwidth goes the other way, with STREAM Triad at 81.5GB/s on the T1g’s LPDDR5X-8533, level with the P1 and Precision, against 121 to 123GB/s on the N1X’s LPDDR5X-9400. Memory latency at 4KiB pages was 117.2ns, within 2ns of the other Intel systems.
Gaming and GPU Encoding
| SuperTuxKart 1.5 (higher is better) | Lenovo ThinkPad T1g Gen 9 (366H, RTX 5070 12GB) | Lenovo ThinkPad P1 Gen 9 (386H, RTX PRO 2000 8GB) | Dell Pro Precision 5 16S (X9 388H, Arc Pro B390) | Razer Blade 16 (HX 370, RTX 5090 24GB) | Dell XPS 16 Creator Edition (N1X, 64GB) | HP OmniBook Ultra 16 (N1X, 128GB) |
|---|---|---|---|---|---|---|
| SuperTuxKart 1080p, average FPS | 206.8 | 179.2 | 168.0 | 199.6 | 248.6 | 269.7 |
| SuperTuxKart 1080p, typical FPS | 206 | 178 | 167 | 194 | 250 | 271 |
| SuperTuxKart 1080p, mostly stable FPS | 173 | 148 | 137 | 167 | 214 | 236 |
| SuperTuxKart 1080p, steady FPS | 45 | 67 | 88 | 118 | 131 | 141 |
In SuperTuxKart, the suite’s only gaming benchmark, the T1g averaged 206.8 fps across three passes at 1080p using the highest preset, 15 percent faster than the P1 with its RTX PRO 2000. The Blade 16’s RTX 5090 does not pull ahead at 199.6 fps, which suggests the test stops scaling with GPU power at this resolution. The N1X laptops lead at 248.6 and 269.7 fps. The display tops out at 3200×2000, so the suite’s 4K pass did not run.
The game’s steady FPS figure shows the effect of heat soak: the first measured pass after the warm-up reported 81 fps and the next two reported 44 and 45, so the median we publish is 45, the lowest in this group. Over roughly four minutes of testing, the GPU climbed from 44C to 66C, and the CPU from the high 70s to 86C, and the floor dropped once the chassis warmed up, while the average held between 205 and 207 fps on every pass. The pattern points to deeper frame-rate dips once the system is warm than a cold first run shows.
For GPU encoding, FFmpeg 8.1 with HEVC NVENC ran at 149 fps on the suite’s Big Buck Bunny clip. The FFmpeg 9 path requires NVENC API 13.1 and NVIDIA driver 610 or newer, and the T1g ships with driver 597.01 under our OEM-driver rule, so that row is absent here.

Thermals and Clocks Under Load
| Lenovo ThinkPad T1g Gen 9 | CPU Max (C) | CPU Mean (C) | Mean CPU Clock (MHz) |
|---|---|---|---|
| Cinebench 2026 | 94.1 | 87.8 | 3,785 |
| 7-Zip | 95.1 | 87.1 | 3,810 |
| Blender | 95.1 | 91.8 | 3,602 |
| GROMACS | 95.1 | 94.6 | 3,538 |
| 30-minute Cinebench loop | 95.1 | 92.9 | 3,576 |
| MLPerf Client | 91.1 | 77.0 | 3,551 |
| LLM serving | 90.1 | 85.1 | 3,888 |
| SuperTuxKart | 86.1 | 81.1 | 3,425 |
| Storage | 85.1 | 69.1 | 3,130 |
The 366H reached 94C to 95C in every sustained CPU test and held there without the clock collapsing, with the mean under those loads between 3,538 and 3,810MHz. GROMACS was the hardest on the cooling system, with a 94.6C mean. GPU-led work ran cooler on the processor side, and the RTX 5070 peaked at 76C during LLM serving and 74C during MLPerf Client. The SSD peaked at 69C during the 75-minute storage run and stayed below 40C in the other tests. In use, we saw no thermal issues and no excessive fan noise under load.

Storage Performance
| fio, 25GiB footprint (higher is better) | Lenovo ThinkPad T1g Gen 9 (366H, RTX 5070 12GB) | Lenovo ThinkPad P1 Gen 9 (386H, RTX PRO 2000 8GB) | Dell Pro Precision 5 16S (X9 388H, Arc Pro B390) | Razer Blade 16 (HX 370, RTX 5090 24GB) | Dell XPS 16 Creator Edition (N1X, 64GB) | HP OmniBook Ultra 16 (N1X, 128GB) |
|---|---|---|---|---|---|---|
| Sequential read 128K (MB/s) | 13,525 | 10,012* | 9,456 | 7,106 | 6,502 | 13,598 |
| Sequential write 128K (MB/s) | 9,238 | 9,203 | 9,257* | 5,257 | 5,670 | 11,899 |
| Random read 4K, peak (IOPS) | 728,827 | 756,484 | 778,094 | 732,774 | 300,063 | 449,043 |
| Random write 4K, peak (IOPS) | 605,858 | 682,019* | 649,544 | 522,707* | 256,856 | 234,888 |
| Random read 4K, QD32 x 4 jobs (IOPS) | 384,475 | 501,165 | 528,105 | 316,943 | 300,063 | 449,043 |
| Random write 4K, QD32 x 4 jobs (IOPS) | 307,270 | 444,243 | 432,635 | 374,728 | 256,856 | 234,888 |
*Flagged by the suite for run-to-run variance after a rerun.
The 2TB drive in our unit is a Micron PCIe Gen5 SSD, and its sequential numbers are among the best in this group: 13,525MB/s read, and 9,238MB/s write on the 25GiB footprint, level with the OmniBook’s Sandisk drive on reads and well ahead of the Gen4 drives in the Blade 16 and XPS 16.
Random performance is less convincing at lower thread counts. Peak 4K random read reached 729K IOPS, in line with the Gen5 drives in the other Intel systems, but at QD32 across four jobs the T1g managed 384K read and 307K write IOPS against 501K and 444K for the SK hynix drive in the P1 and 528K and 433K in the Precision. Peak random write at 606K IOPS is also the lowest of the three Intel systems. One 5GiB random read configuration was flagged for variance and is left out here. Lenovo may ship other drives under the same 2TB Gen5 option, so these figures describe our unit.


Conclusion
The ThinkPad T1g Gen 9 is the P1 Gen 9 for buyers who want more GPU and don’t need workstation certification. In our testing, the GeForce RTX 5070 matched or beat the P1’s RTX PRO 2000 on every GPU test both systems ran except RAG ingest, where the P1 led by 3 percent, and its 12GB of memory loaded an 8B serving model and FLUX.2 image generation that the 8GB card could not. The Core Ultra 7 366H gave up 3 percent to the Core Ultra 9 in multi-core work and held 99.5 percent of its opening Cinebench score across 30 minutes.

The limits show in the data as well, starting with memory: 12GB is still under the 16GB our tiered local AI tests require, so the N1X laptops with unified memory and the 24GB Blade 16 run models the T1g can’t, and the N1X leads multi-core CPU work by 35 to 42 percent. SuperTuxKart’s steady frame rate fell by nearly half once the chassis warmed, and the Micron SSD pairs sequential speed that is among the best in this group with random performance that trails the P1’s drive at lower thread counts.
That makes the T1g a good fit for creative professionals, engineers, and developers who want one managed ThinkPad for office work, GPU rendering, small-model AI, and after-hours gaming, and who have no ISV requirement. Buyers who need certified drivers should stay with the P1, and buyers whose priority is running the largest local models on a notebook should look at the N1X systems.
Our T1g configuration lists at $5,349, and Lenovo sells the Yoga 9n 2-in-1 16 with the 20-core RTX Spark N1X, 64GB of unified memory, and a 1TB SSD for $3,749.99 at Best Buy, $1,599 less. In our review, the Yoga scored 6,292 in Cinebench 2026 multi-core against 4,928 here, and its 32GB of GPU-usable memory ran the 20B model tier that the T1g’s 12GB card could not load. The T1g remains quicker on models that fit, at 66.2 tokens per second against 54.4 in MLPerf Client. With so many choices available to buyers, it’s important to match your expected workloads to the best hardware.
Lenovo deserves credit for covering each of these buyers within one portfolio: the P1 for certified workstation graphics, the T1g for GeForce in a managed ThinkPad, and the Yoga 9n for RTX Spark. The T1g keeps the case for x86 software, vPro management, a 2TB Gen5 SSD, and the ThinkPad keyboard and TrackPoint. At current market pricing, a buyer who does not need those may find the Yoga the better fit, with more CPU throughput and more usable GPU memory at a lower price.

Leaderboard: The Lenovo ThinkPad T1g Gen 9 holds Best Business Laptop with Discrete Graphics on our Best Business Laptops leaderboard.



 Amazon