

The Solidigm D5-P5430 is the mainstream tier of Solidigm’s QLC data center line. It’s the drive that sits below the capacity-maximizing D5-P5336 and carries a smaller indirection unit for the mixed and small-block write workloads a 16KB-IU drive handles poorly. We reviewed the 15.36TB P5430 at launch in 2023, when the story was the jump from the P5316’s 64KB indirection unit to 4KB and what that did for small-block writes. The 30.72TB E3.S model in the lab now tops the family with an 8KB indirection unit, and it arrives into a very different comparison set: the high-capacity QLC class has moved to 61TB, 122TB, and 245TB drives, several of them on Gen5, while the P5430 is a PCIe 4.0 x4 drive, tested here in the 7.5mm E3.S form factor the family offers alongside U.2 and E1.S.
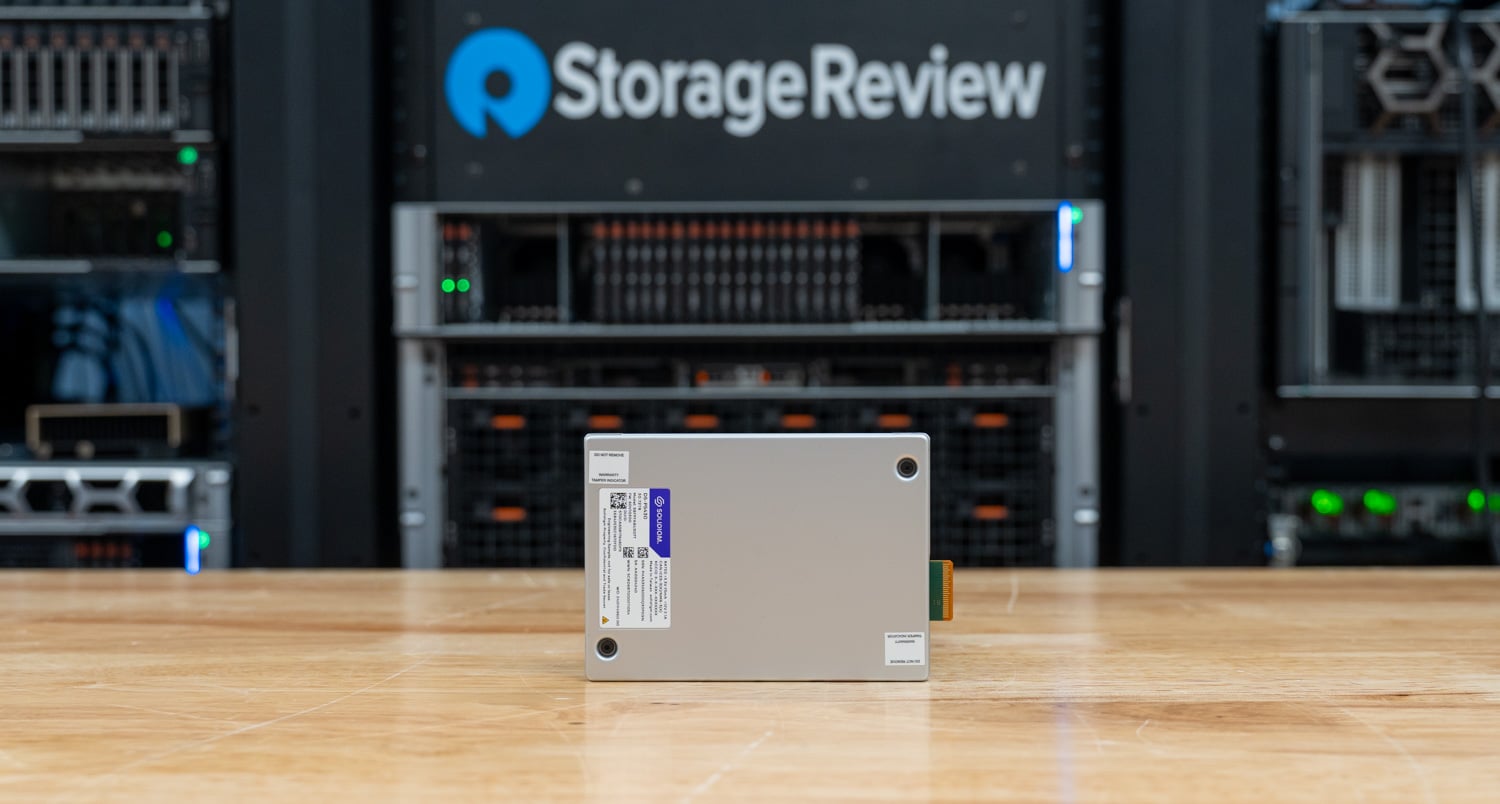
Solidigm rates the family at up to 7,000MB/s sequential read and 3,000MB/s sequential write, up to 971K random read IOPS and 120K random write IOPS, with the 30.72TB model specifically listed at 934.5K random read IOPS and 31.92PBW of endurance, which works out to 0.58 DWPD over the five-year warranty on a 100 percent random write workload. Power is rated at up to 25W active and 5W idle.
Solidigm’s pitch for the P5430 has always been density with a TLC-like read profile at QLC cost. The drive carries the enterprise checklist: 192-layer 3D QLC NAND behind Solidigm’s own controller and firmware, PCIe 4.0 x4 with NVMe 1.4c, end-to-end data protection with ECC and CRC active together, power loss protection, secure boot, TCG Opal 2.0 and FIPS 140-2 Level 2 options, OCP 2.0 telemetry, and platform validation on Intel, AMD, Ampere, and NVIDIA. The family spans 3.84TB to 30.72TB in U.2 15mm and E3.S 7.5mm, with E1.S 9.5mm topping out at 15.36TB.
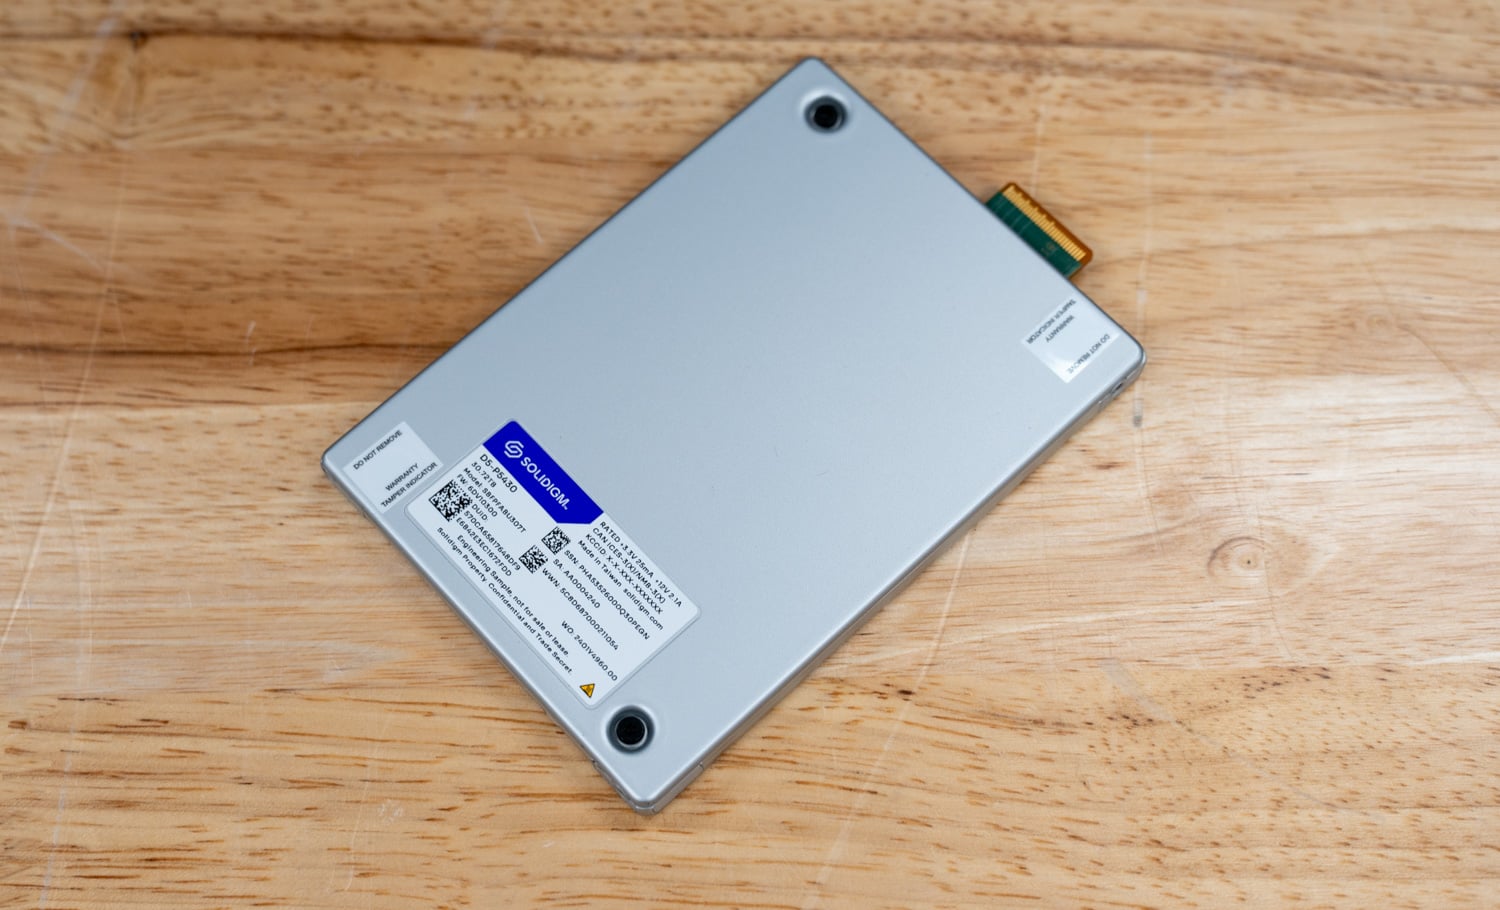
Solidigm D5-P5430 30.72TB Specifications
| Specification | Solidigm D5-P5430 30.72TB |
|---|---|
| Platform Overview | |
| Capacity (tested) | 30.72TB |
| Family Capacities | U.2 and E3.S: 3.84TB, 7.68TB, 15.36TB, 30.72TB E1.S: 3.84TB, 7.68TB, 15.36TB |
| Form Factor | U.2 15mm E3.S 7.5mm (tested) E1.S 9.5mm |
| Interface | PCIe 4.0 x4, NVMe 1.4c |
| NAND | 192-layer 3D QLC |
| Indirection Unit | 8KB (30.72TB) 4KB (3.84TB to 15.36TB) |
| Performance (vendor rated) | |
| Sequential Read | Up to 7,000MB/s |
| Sequential Write | Up to 3,000MB/s |
| Random 4K Read | Up to 971K IOPS (family) 934.5K IOPS (30.72TB) |
| Random 4K Write | Up to 120K IOPS |
| Power and Endurance | |
| Endurance | 31.92PBW (30.72TB) Up to 0.58 DWPD, 100% random write |
| Power | Up to 25W active Up to 5W idle |
| Warranty | 5 years |
| Features | |
| Data Protection | End-to-end data protection (ECC and CRC) Power loss protection UBER tested to 1E-17 |
| Security | Secure boot TCG Opal 2.0 FIPS 140-2 Level 2 (select SKUs) |
| Management | OCP 2.0 log pages and telemetry |
| Platform Validation | Intel, AMD, Ampere, NVIDIA |
Solidigm D5-P5430 30.72TB Performance
Drive Testing Platform
We use a Dell PowerEdge R760 running Ubuntu 22.04.2 LTS as our test platform for all workloads in this review. Equipped with a Serial Cables Gen5 JBOF, it offers wide compatibility with U.2, E1.S, E3.S, and M.2 SSDs. Our system configuration is outlined below:
- 2 x Intel Xeon Gold 6430 (32-Core, 2.1GHz)
- 16 x 64GB DDR5-4400
- 480GB Dell BOSS SSD
- Serial Cables Gen5 JBOF
Drives Compared
- Solidigm D5-P5430 30.72TB (Gen4 | E3.S 7.5mm)
- Solidigm D5-P5336 61.44TB (Gen4 | U.2)
- Solidigm D5-P5336 122.88TB (Gen4 | U.2)
- DapuStor J5060 61.44TB (Gen4 | U.2)
- DapuStor R6060 122.88TB (Gen5 | E3.L)
- Micron 6550 ION 61.44TB (Gen5 | E3.S, TLC)
- Micron 6600 ION 245.76TB (Gen5 | E3.L)
The comparison group is the high-capacity QLC class as it stands today, with one TLC drive included for scale. The P5430 is the smallest drive in the set and the only one below 61TB, and it shares a Gen4 link with the P5336 61.44TB and P5336 122.88TB and the DapuStor J5060, all three in U.2. The DapuStor R6060, Micron 6600 ION, and Micron 6550 ION bring Gen5 links, so where the P5430 keeps pace with them, it’s doing so with half the bus. Only the TLC 6550 ION shares the P5430’s E3.S form factor; the point of the group is to show where a 30TB Gen4 QLC drive lands when the alternatives on the shelf are bigger, newer, or both.
FIO Performance Benchmark
To measure the storage performance of each SSD across common industry metrics, we use FIO. Each drive undergoes the same testing process, which includes a preconditioning step of two full drive fills with a sequential write workload, followed by steady-state performance measurement. As each workload type being measured changes, we run another preconditioning fill of that new transfer size.
In this section, we focus on the following FIO benchmarks:
- 128K Sequential
- 64K Random
- 4K Random
128K Sequential Write (IODepth 16 / NumJobs 1)
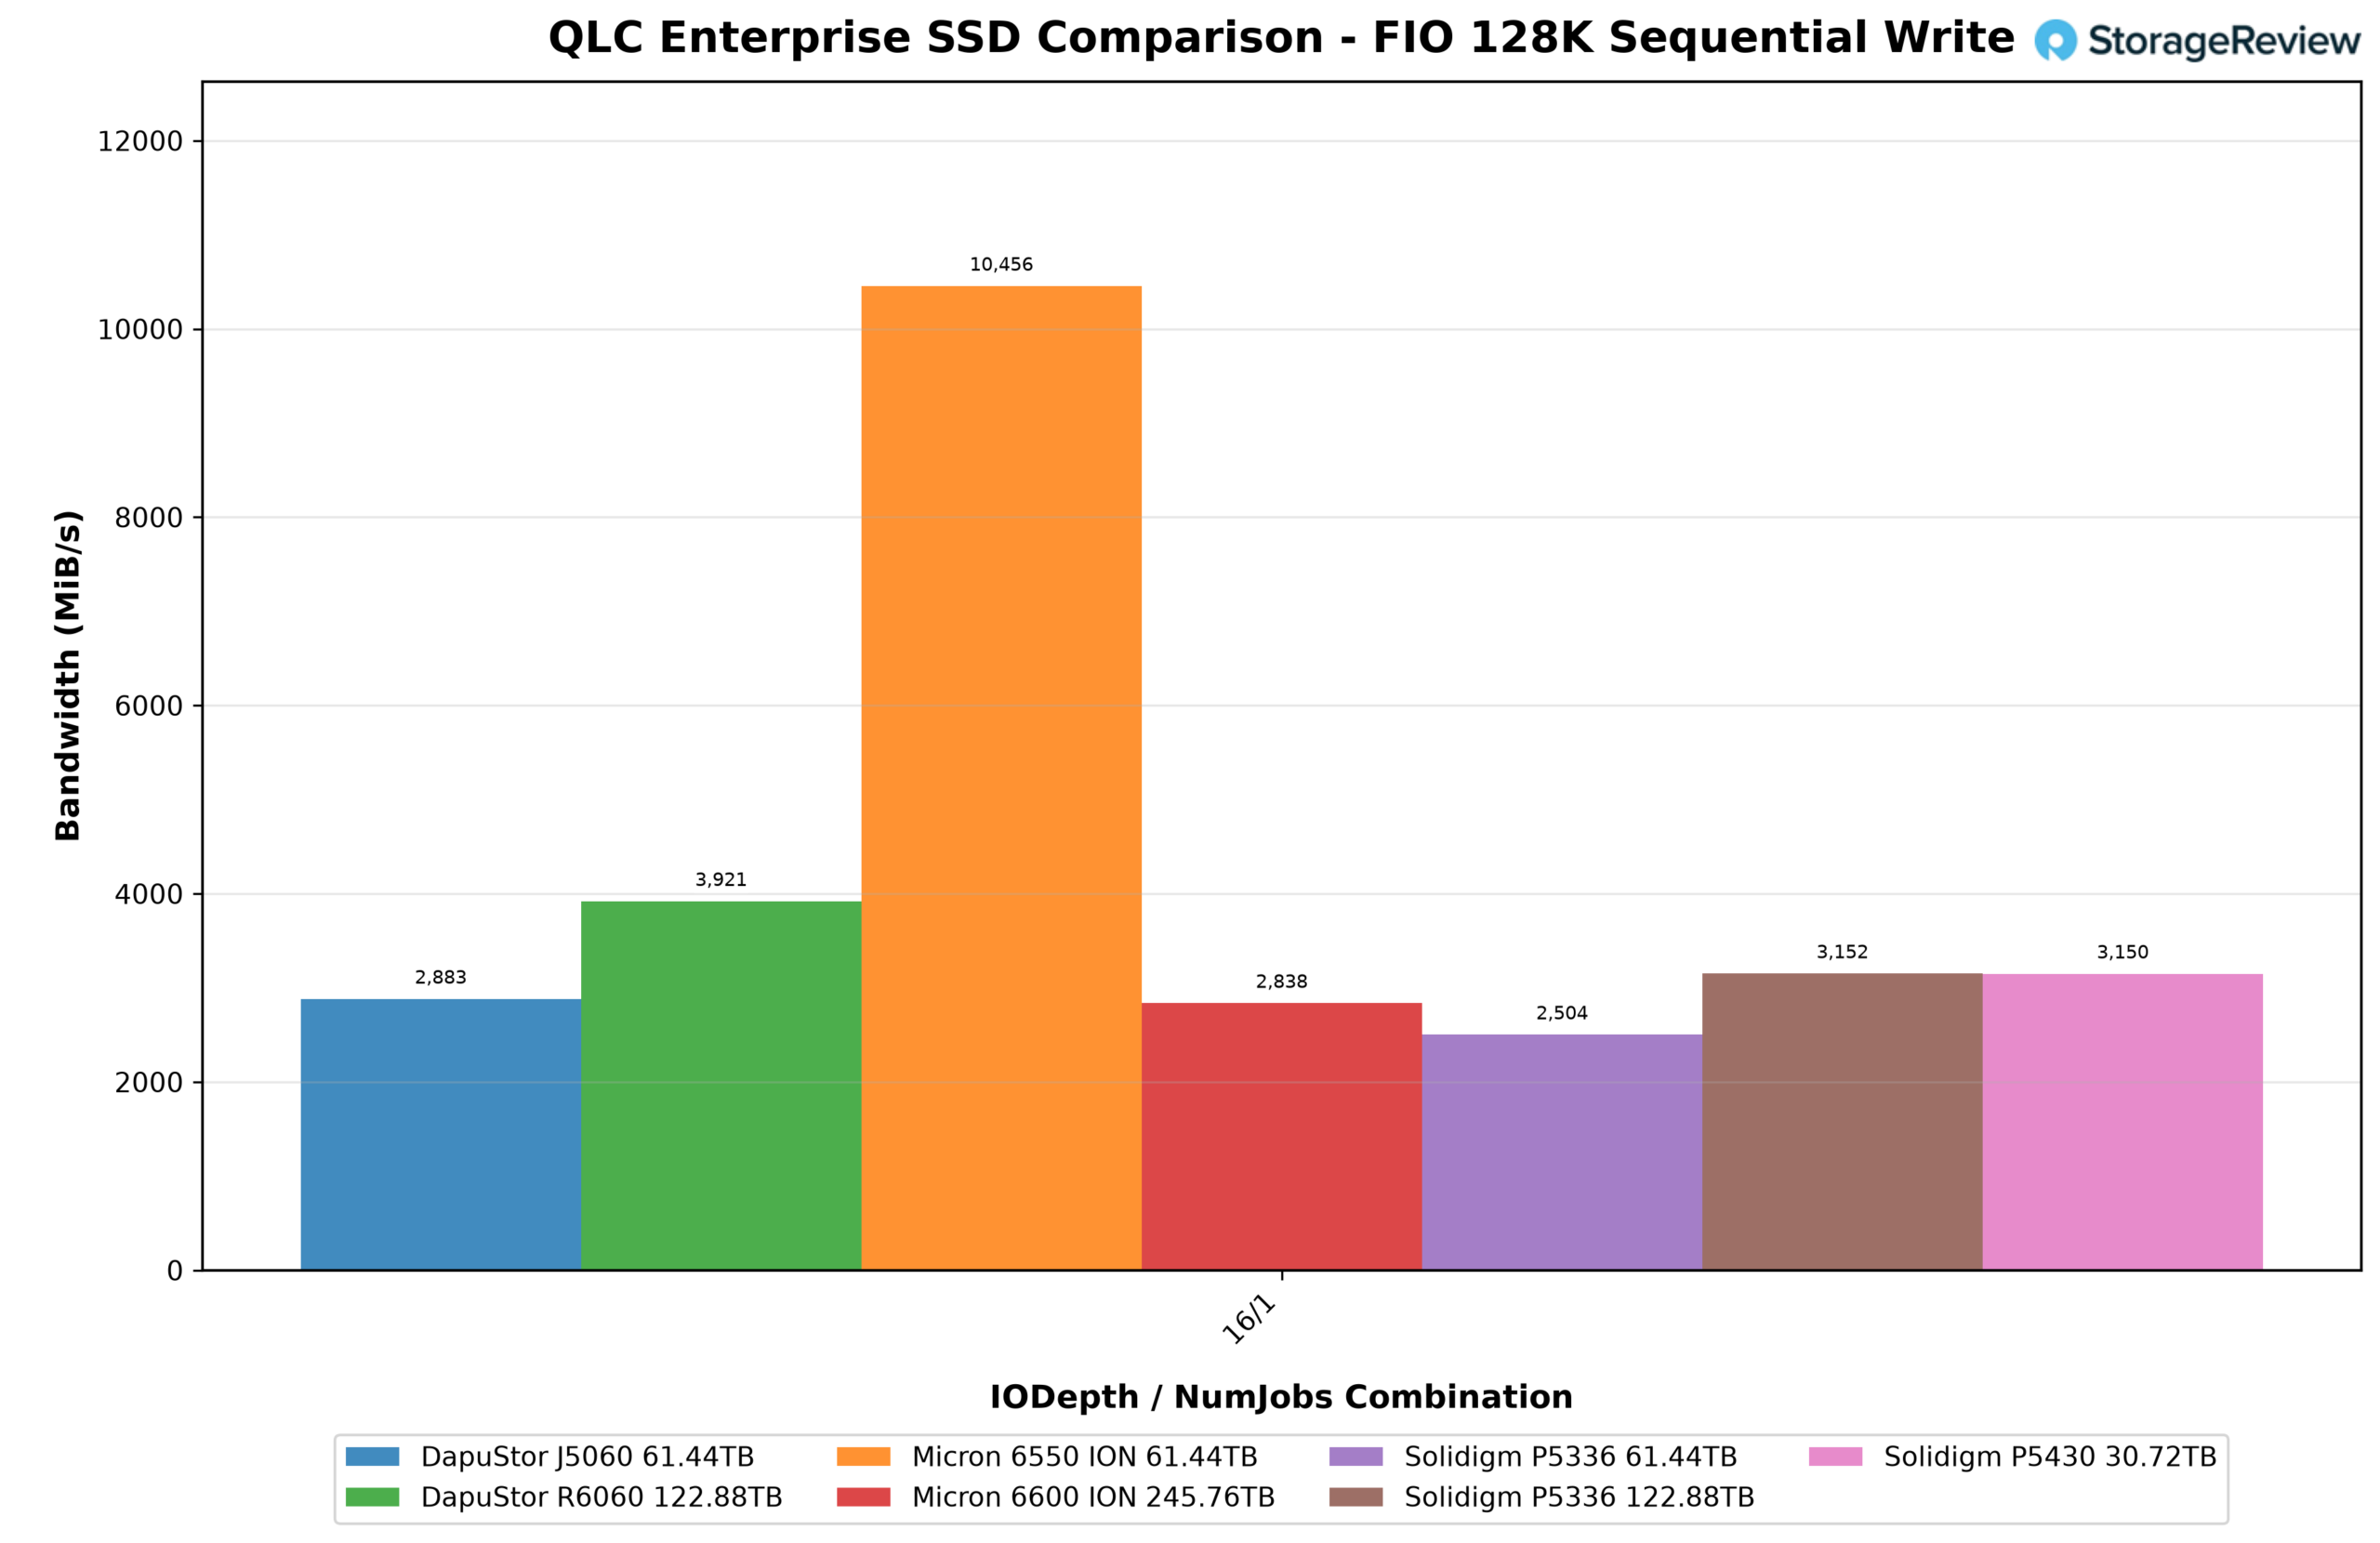
The P5430 delivered 3,150.2MB/s in the 128K sequential write test, exceeding its 3,000MB/s rating and matching the Solidigm P5336 122.88TB at 3,152.5MB/s for the Gen4 QLC lead. The DapuStor R6060 122.88TB reached 3,920.6MB/s on its Gen5 link, and the TLC Micron 6550 ION 61.44TB sat far above the rest at 10,456.4MB/s. Below the P5430 were the DapuStor J5060 61.44TB at 2,883.1MB/s, the Micron 6600 ION 245.76TB at 2,838.0MB/s, and the Solidigm P5336 61.44TB at 2,503.5MB/s, putting the 30.72TB P5430 312.2MB/s ahead of the 245.76TB 6600 ION.
128K Sequential Write Latency (IODepth 16 / NumJobs 1)
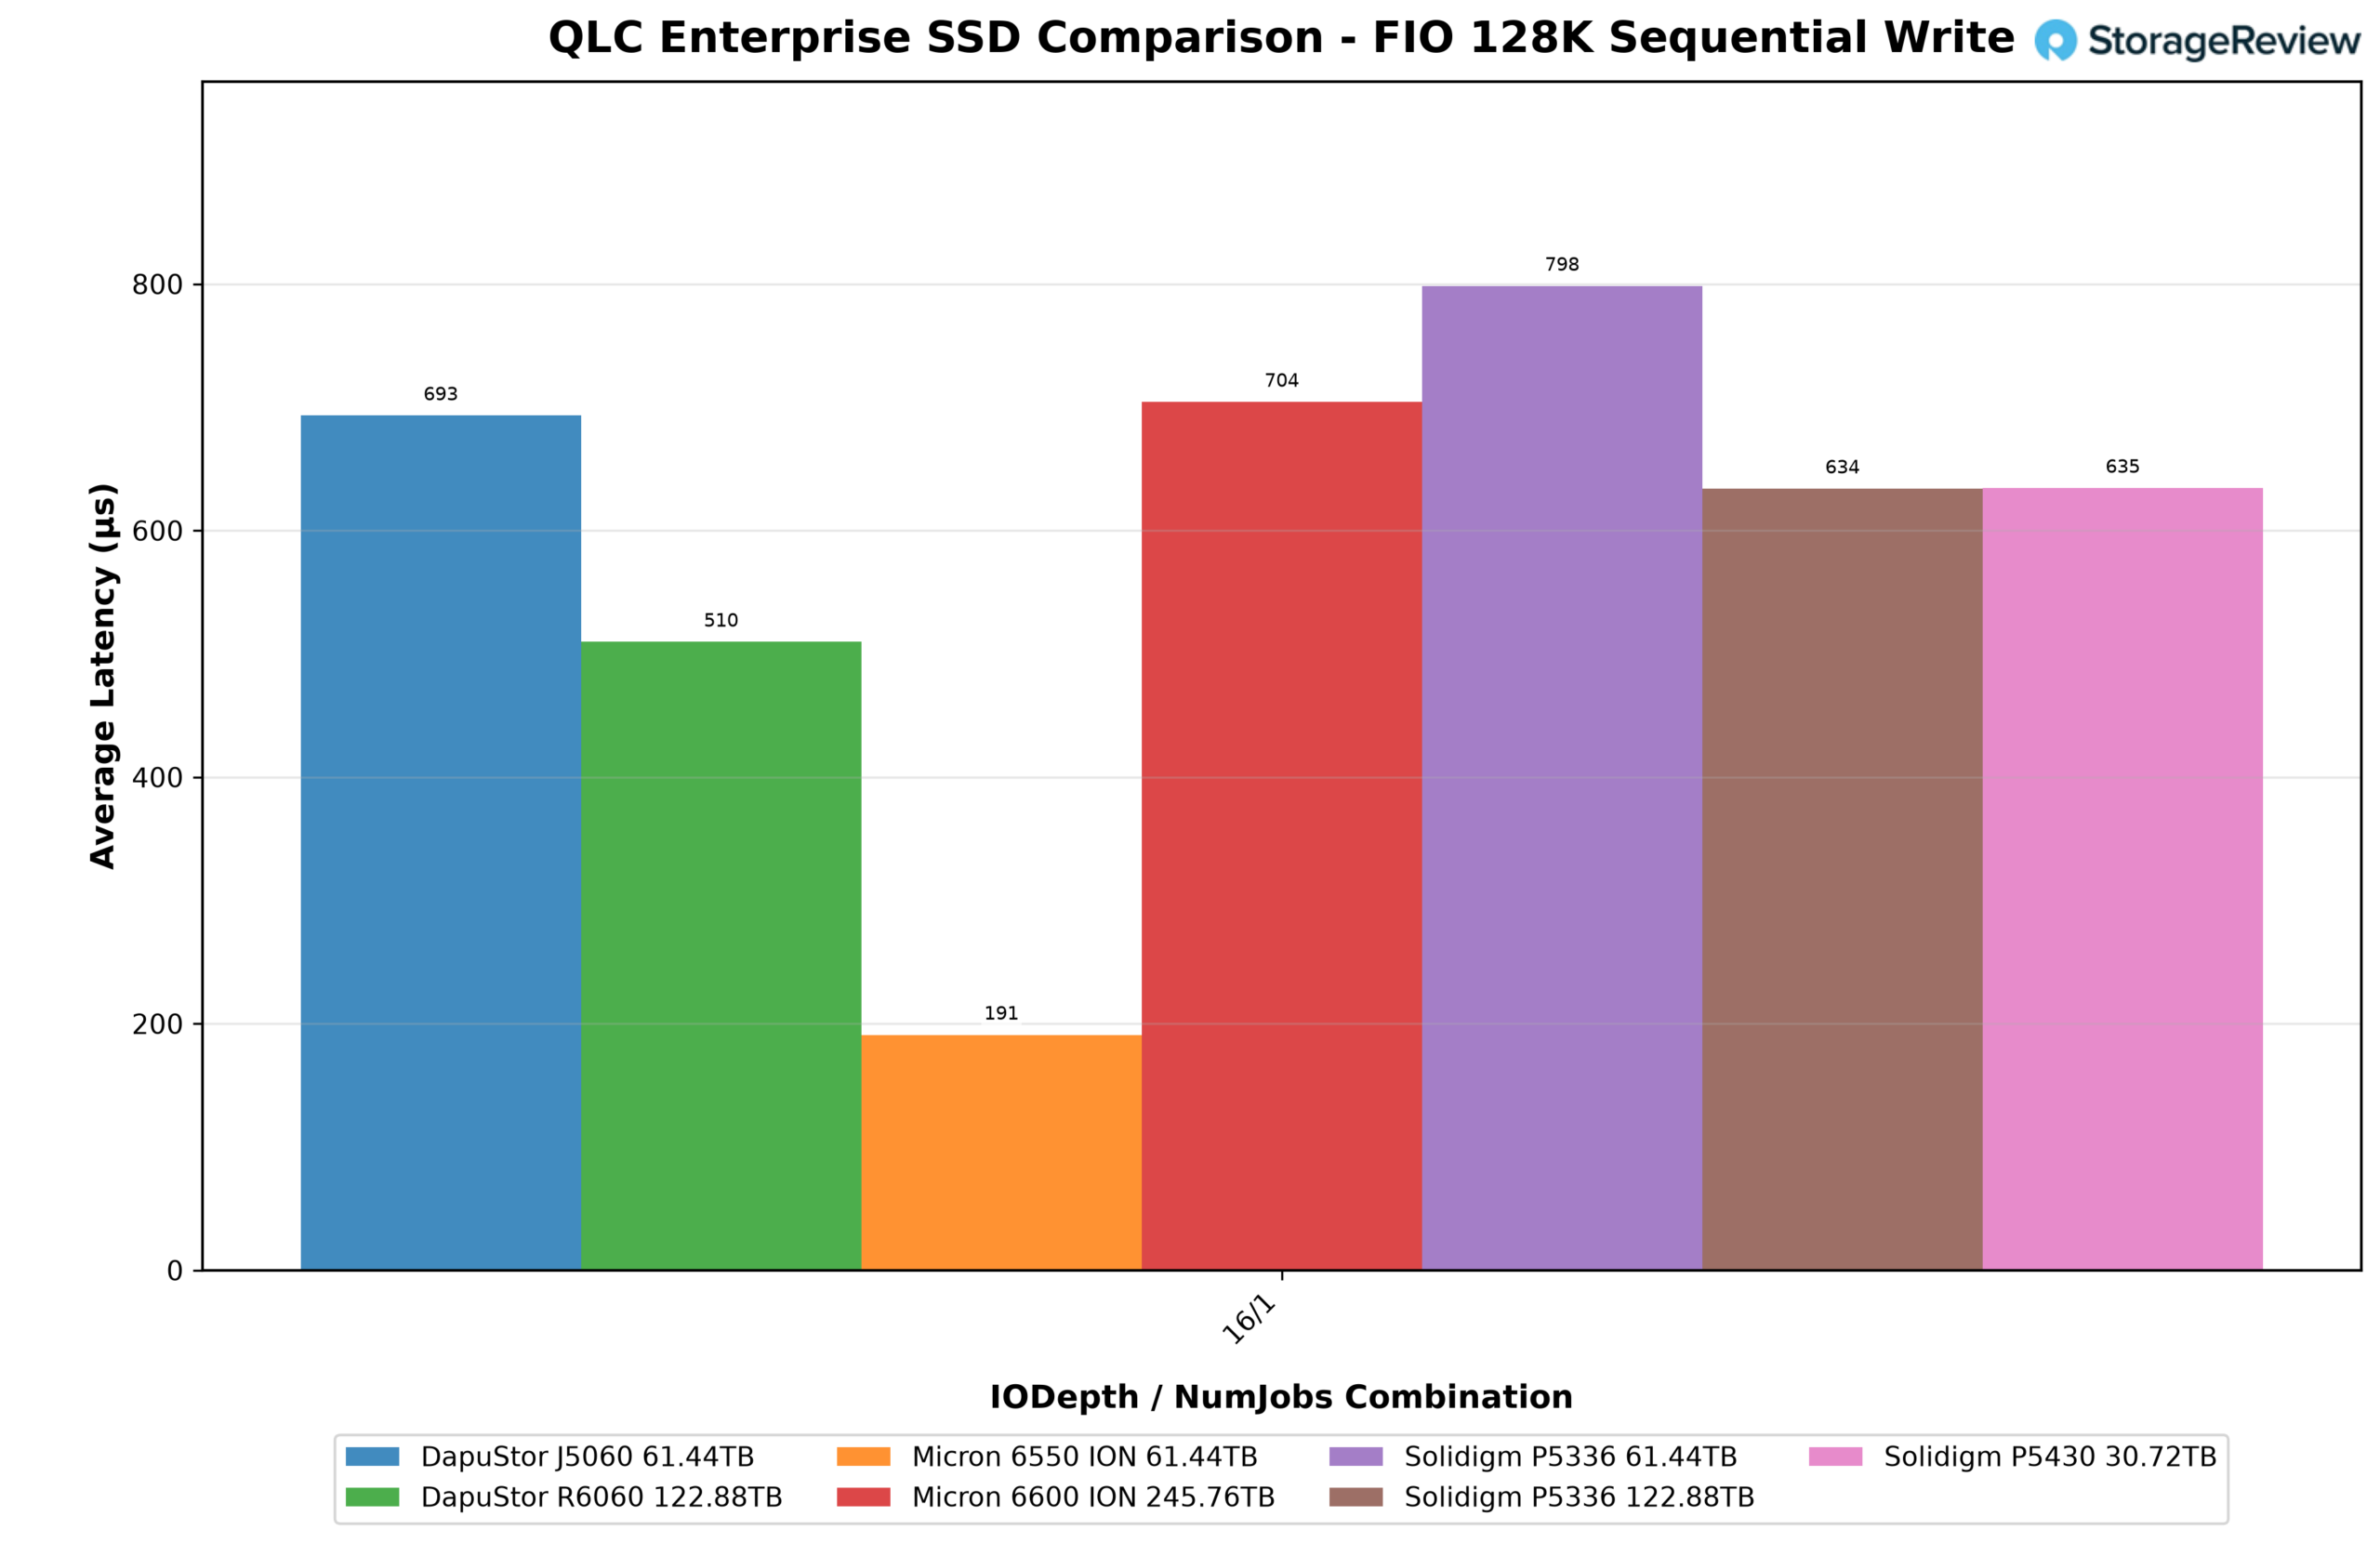
Latency followed bandwidth, with the P5430 at 634.5µs, a whisker from the P5336 122.88TB at 634.0µs and behind only the 6550 ION at 191.0µs and the R6060 at 509.7µs. The J5060 at 693.3µs, the 6600 ION at 704.3µs, and the P5336 61.44TB at 798.4µs trailed.
128K Sequential Read (IODepth 64 / NumJobs 1)
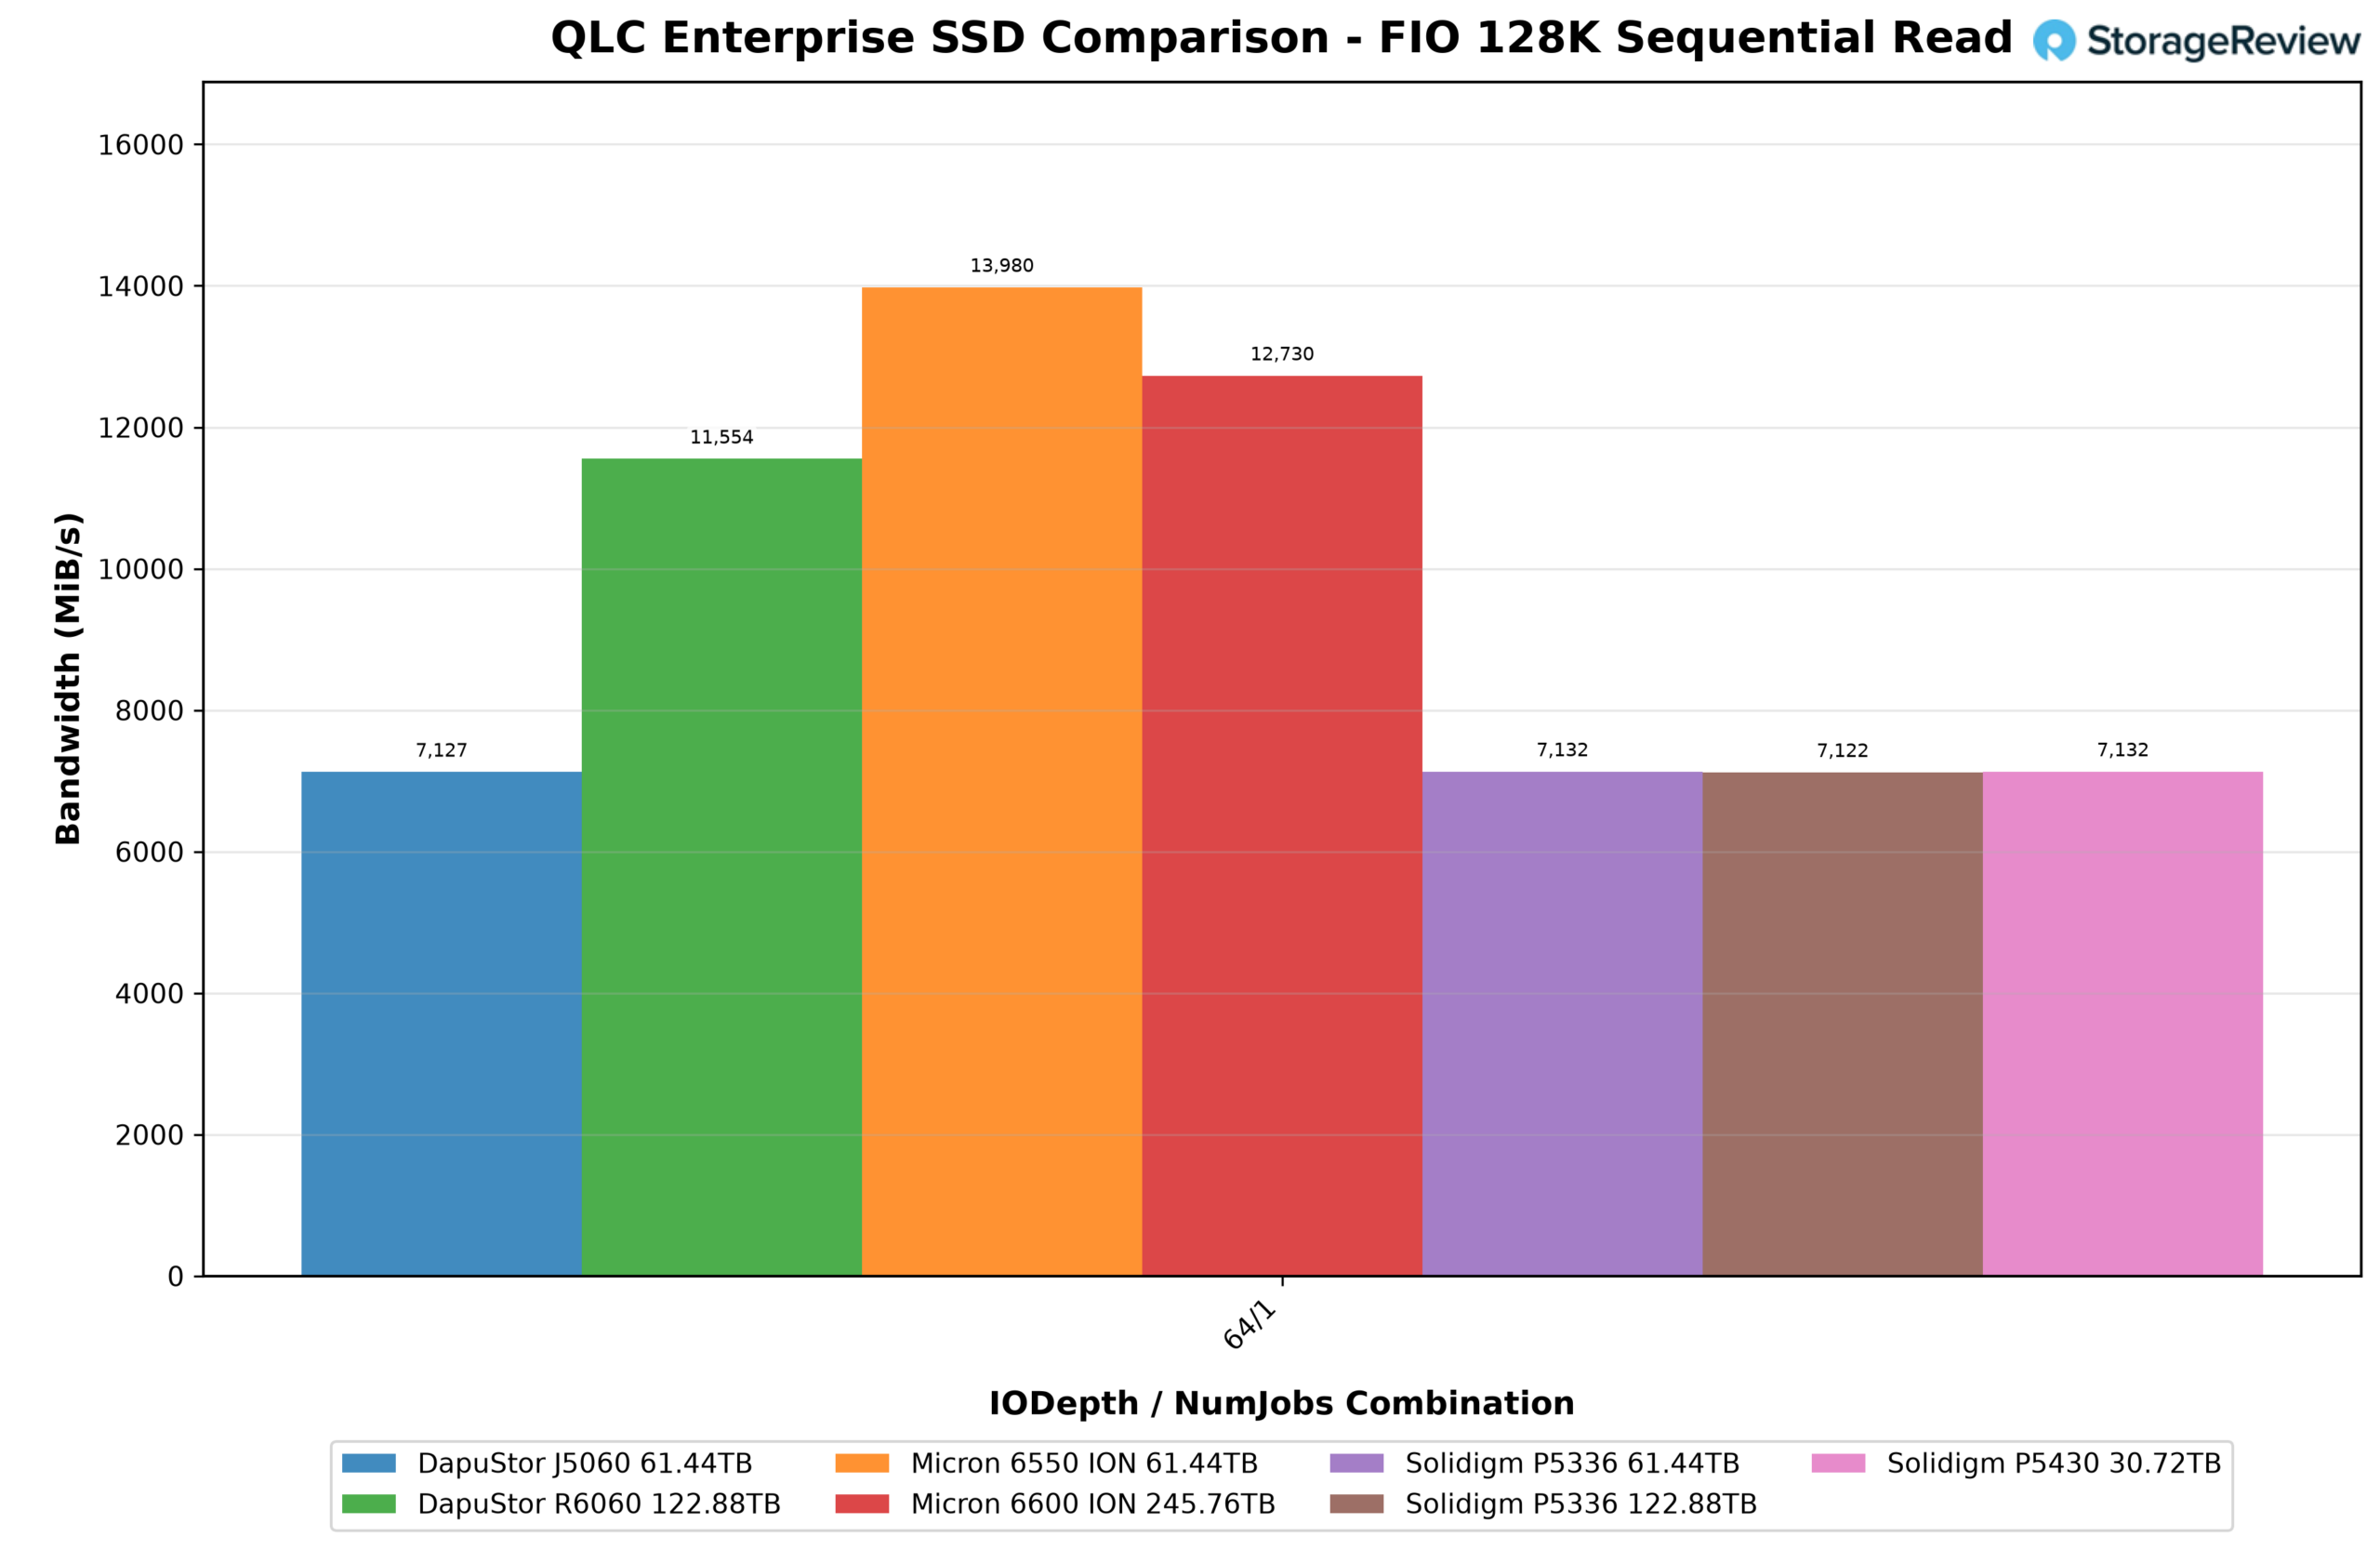
The P5430 posted 7,132.1MB/s in 128K sequential read, effectively identical to the P5336 61.44TB at 7,132.3MB/s, the J5060 at 7,126.8MB/s, and the P5336 122.88TB at 7,121.6MB/s, and a touch above the drive’s 7,000MB/s rating. All four Gen4 drives are pinned at the same ceiling, and the Gen5 drives run away from it: the 6550 ION at 13,979.7MB/s, the 6600 ION at 12,729.8MB/s, and the R6060 at 11,554.0MB/s.
128K Sequential Read Latency (IODepth 64 / NumJobs 1)
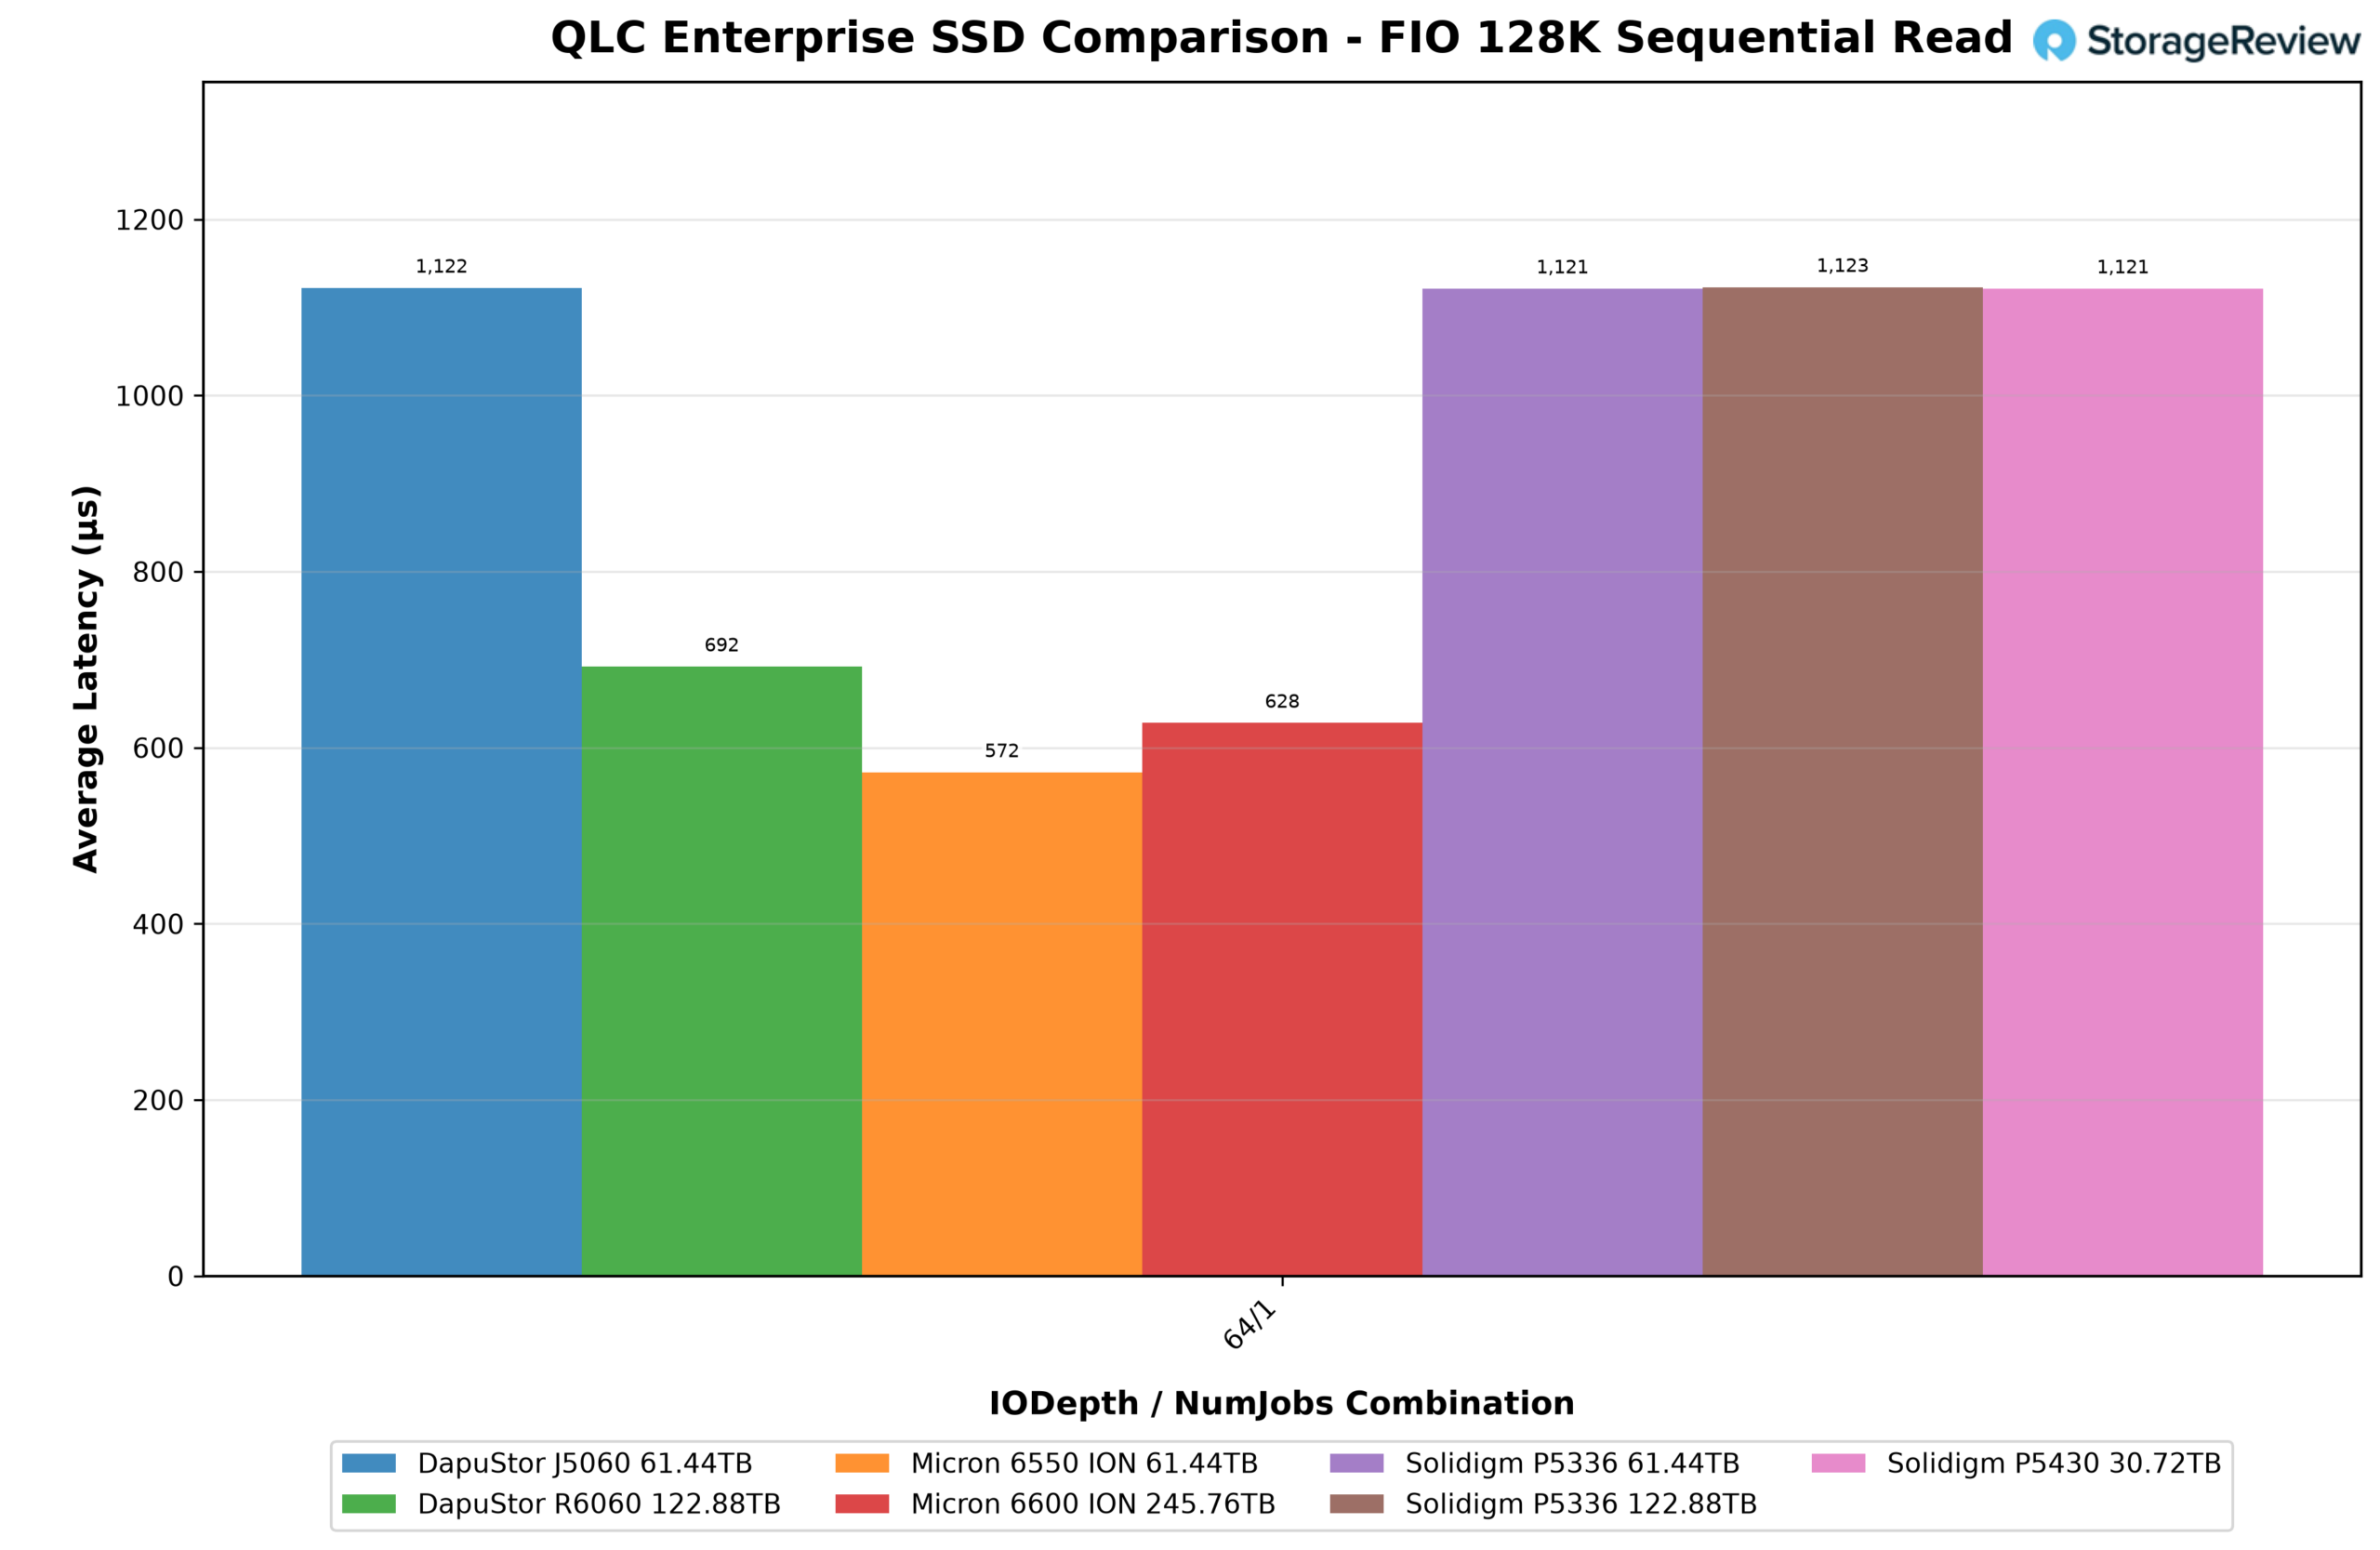
The P5430 recorded 1,121.3µs in 128K sequential read latency, tied with the P5336 61.44TB at 1,121.3µs and within 2µs of the J5060 and P5336 122.88TB. The Gen5 drives finished between 571.9µs (6550 ION) and 692.1µs (R6060).
64K Random Write
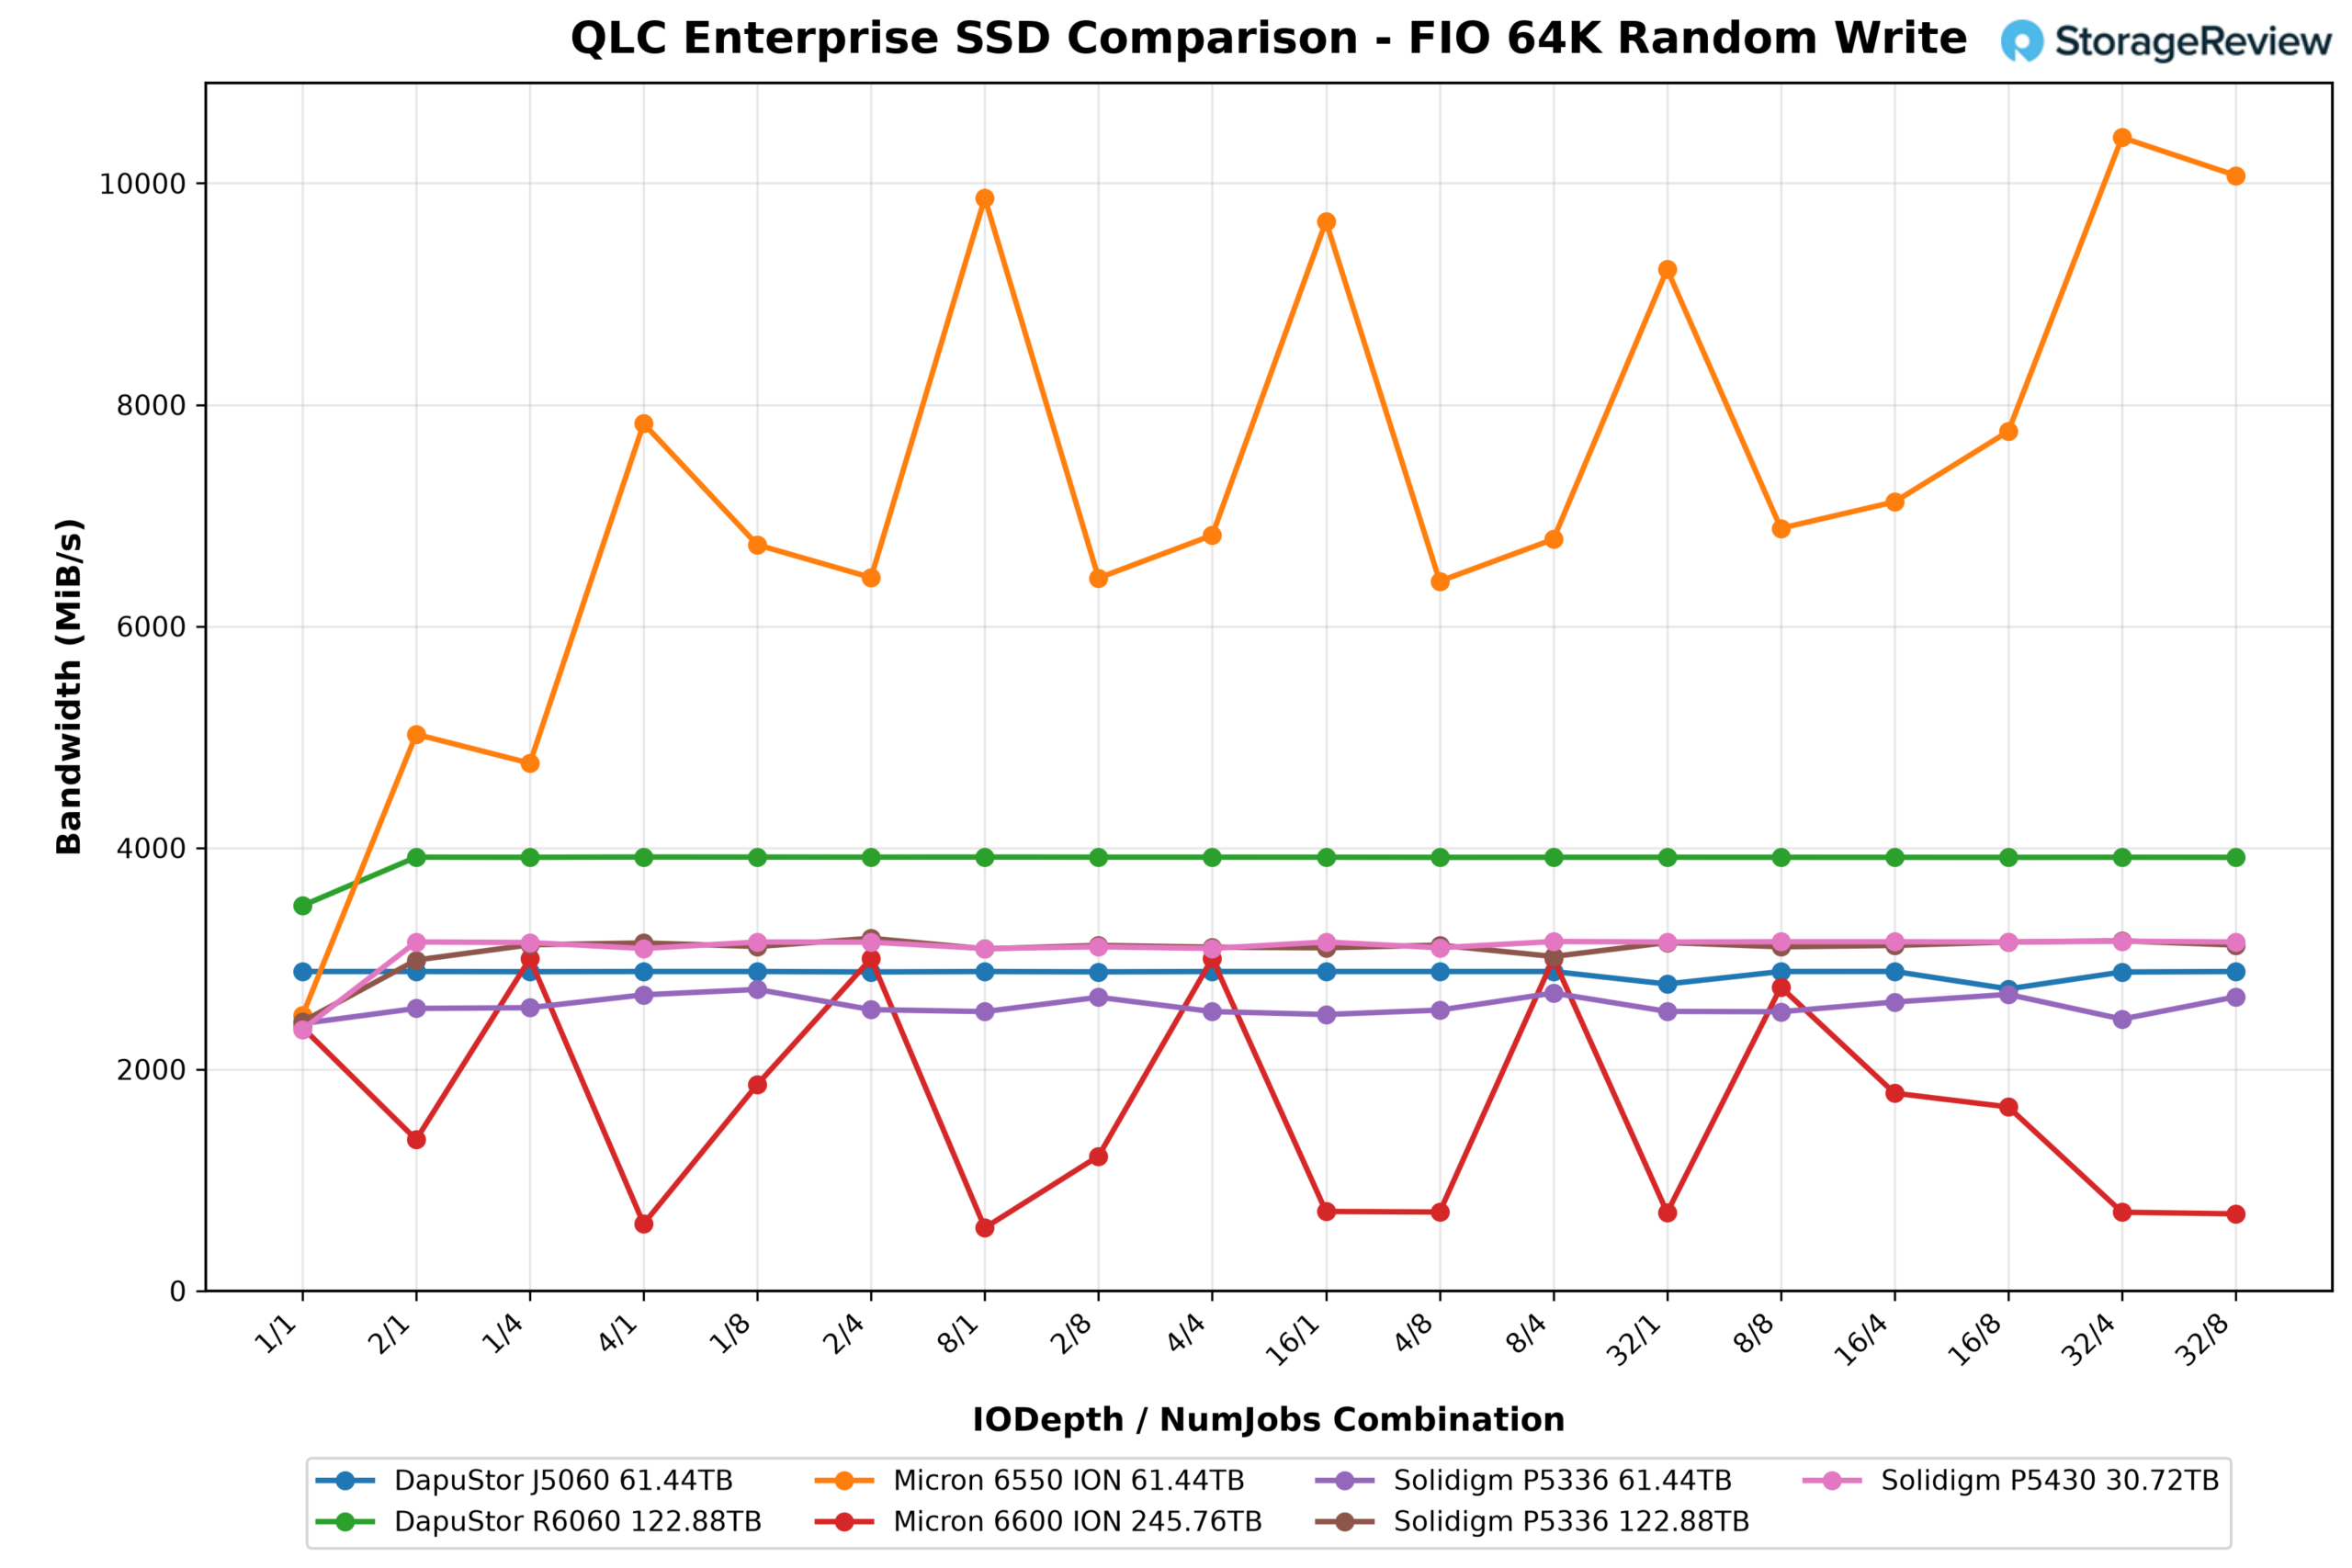
The P5430 opened the 64K random write sweep at 2,359.9MB/s and 37.8K IOPS at 1/1, reached 3,149.9MB/s at 2/1, and then held between 3,090.7MB/s and 3,156.5MB/s across the remaining 16 points of the sweep, peaking at 3,156.5MB/s and 50.5K IOPS at 32/4 and closing at 3,149.6MB/s at 32/8. That’s the same 3.15GB/s write ceiling the 128K test found, and from 2/1 on, the P5430 sat at that level at every queue depth and job count.
In the group, the P5336 122.88TB ran a near-identical plateau, from 2,429.9MB/s to 3,182.7MB/s, and the R6060 held between 3,913.8MB/s and 3,916.9MB/s after starting at 3,477.9MB/s. The J5060 stayed close to 2,883MB/s with two dips into the 2,700MB/s range, and the P5336 61.44TB ran between 2,412.9MB/s and 2,721.4MB/s. The 6600 ION swung between 569.1MB/s and 2,999.6MB/s depending on the combination, and finished at 694.8MB/s and 11.1K IOPS at 32/8, while the TLC 6550 ION sat in another class, reaching up to 10,413.1MB/s.
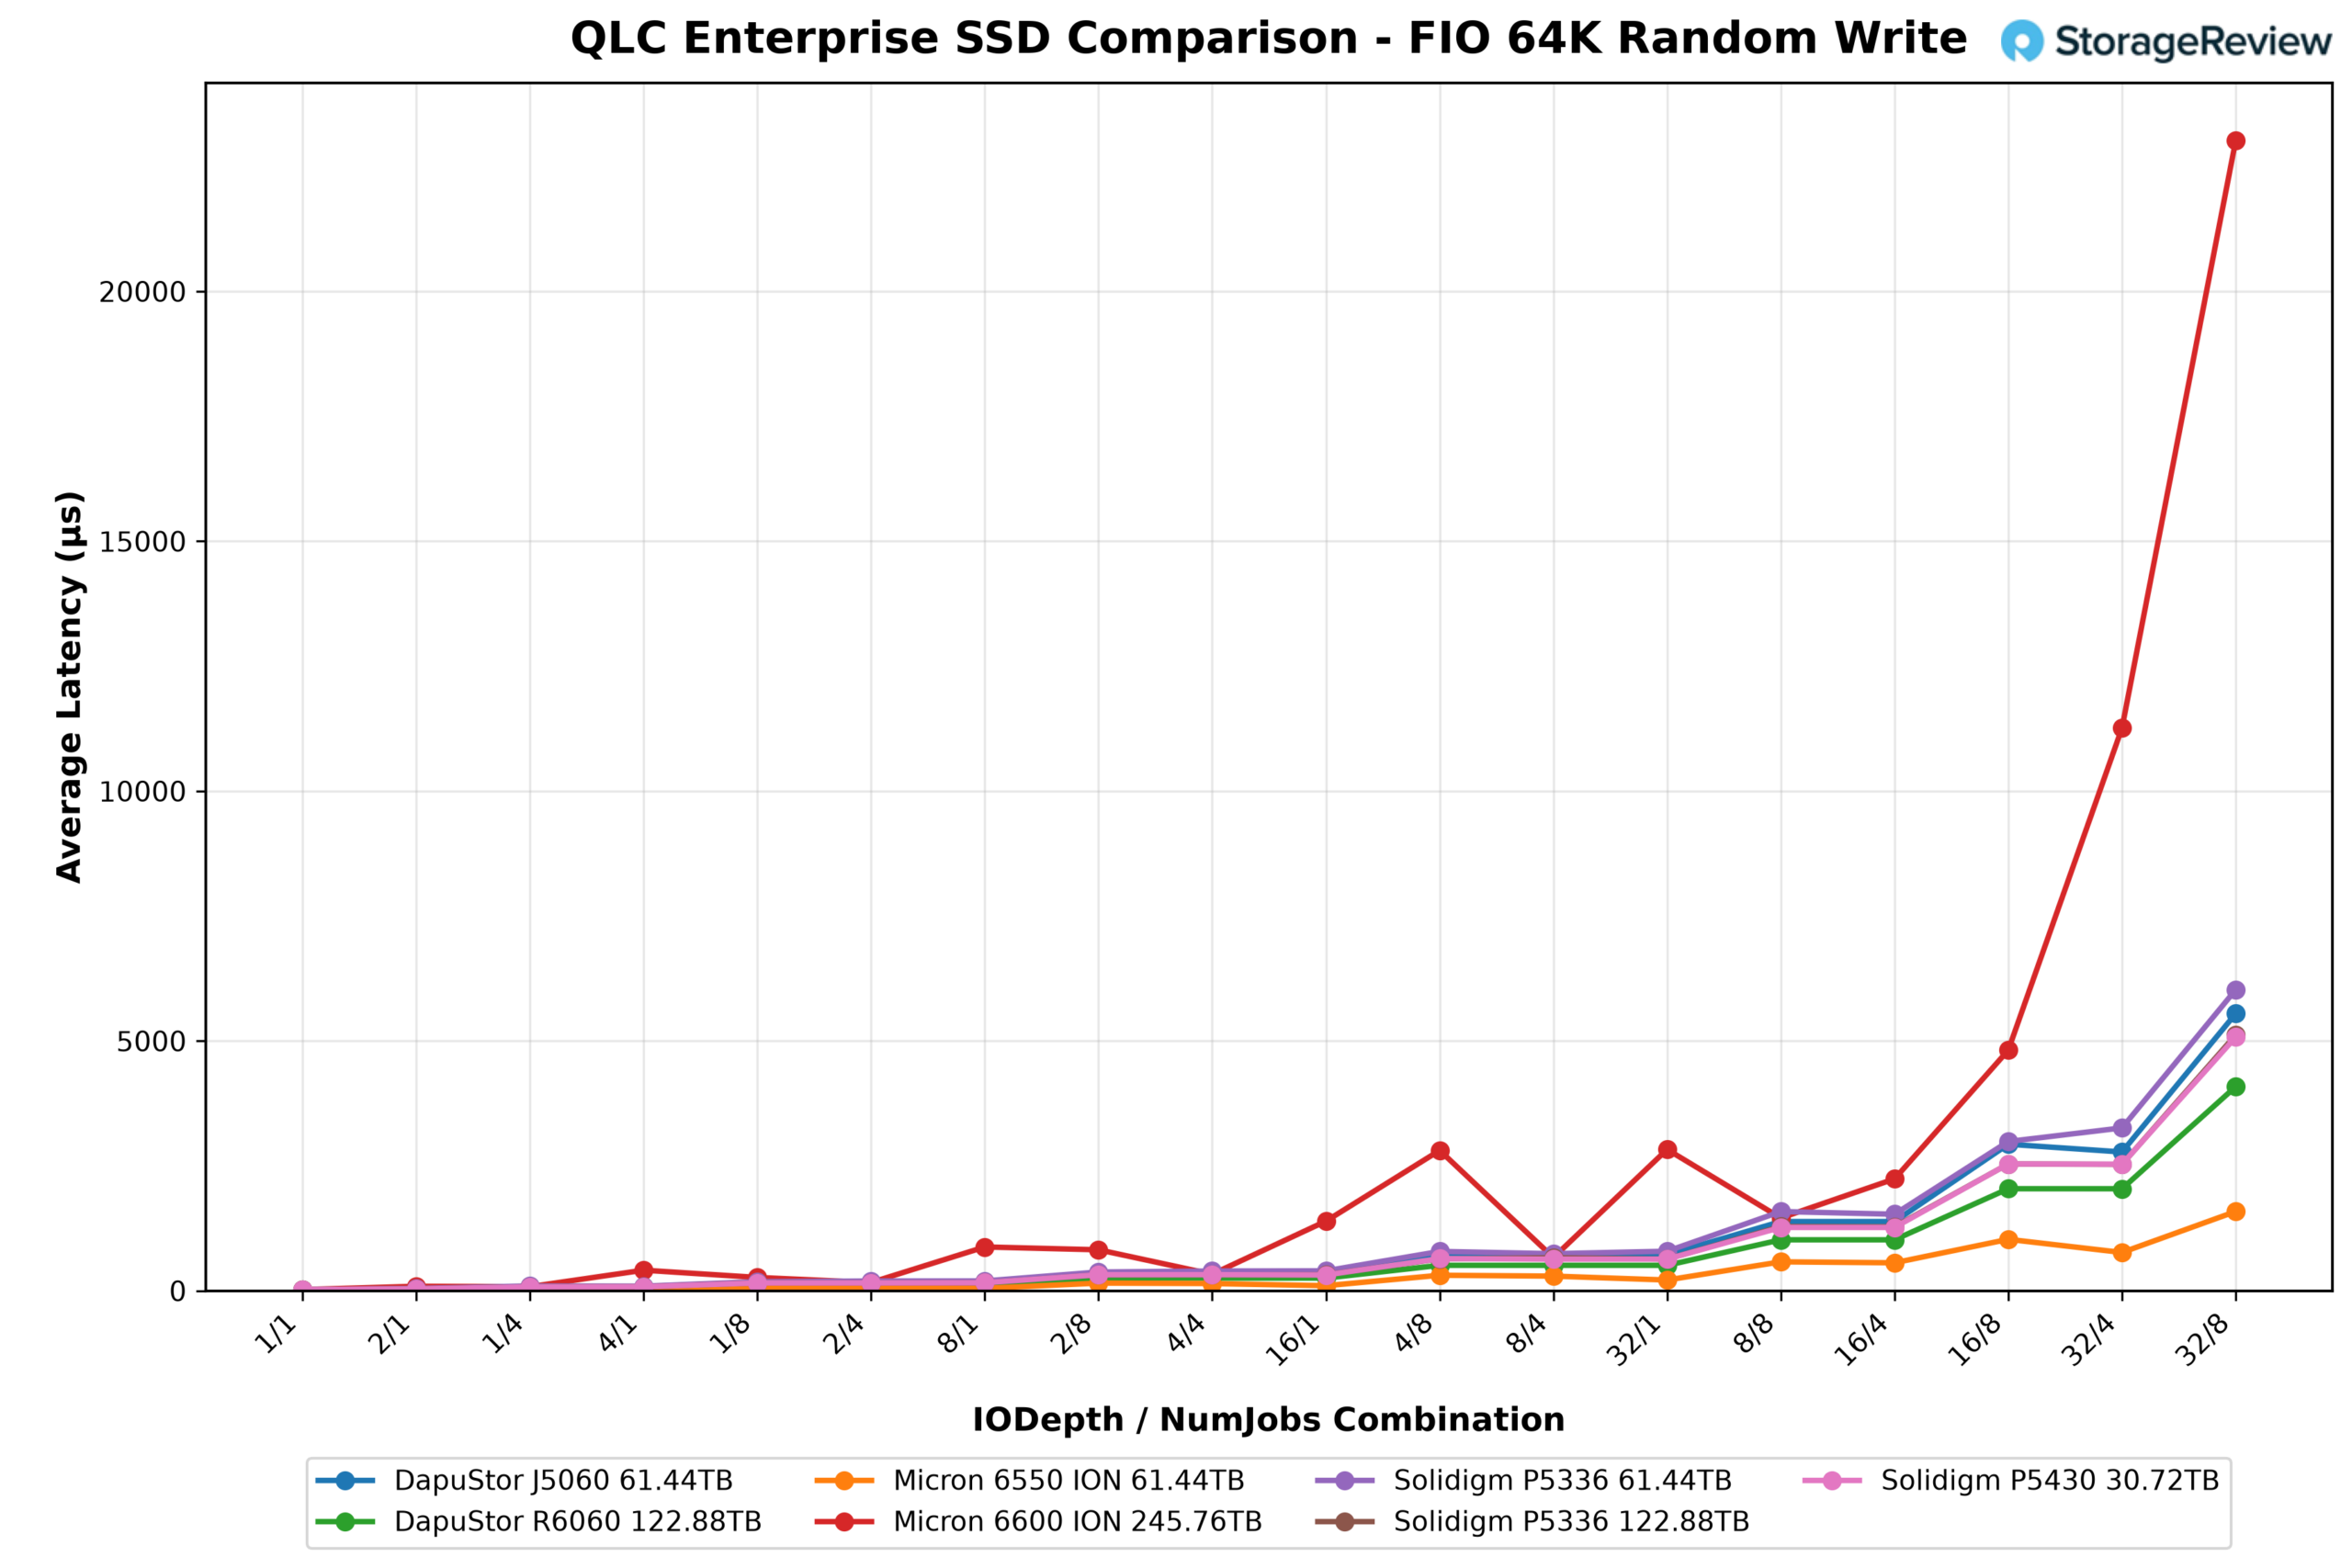
64K Random Write Latency
Because throughput was flat, the P5430’s latency scaled almost exactly with outstanding I/O: 26.1µs at 1/1, 39.3µs at 2/1, 79.0µs to 80.5µs at four outstanding, 158.3µs to 161.4µs at eight, 317.1µs to 322.9µs at 16, 633.7µs to 645.2µs at 32, 1,268.6µs at 64, 2,533.9µs to 2,539.5µs at 128, and 5,079.3µs at 32/8. The P5336 122.88TB ended at 5,121.2µs, the J5060 at 5,548.9µs, and the P5336 61.44TB at 6,026.4µs, while the R6060 closed at 4,086.6µs and the 6550 ION at 1,588.0µs. The 6600 ION’s write swings showed up in latency too, at 23,020.7µs at 32/8.
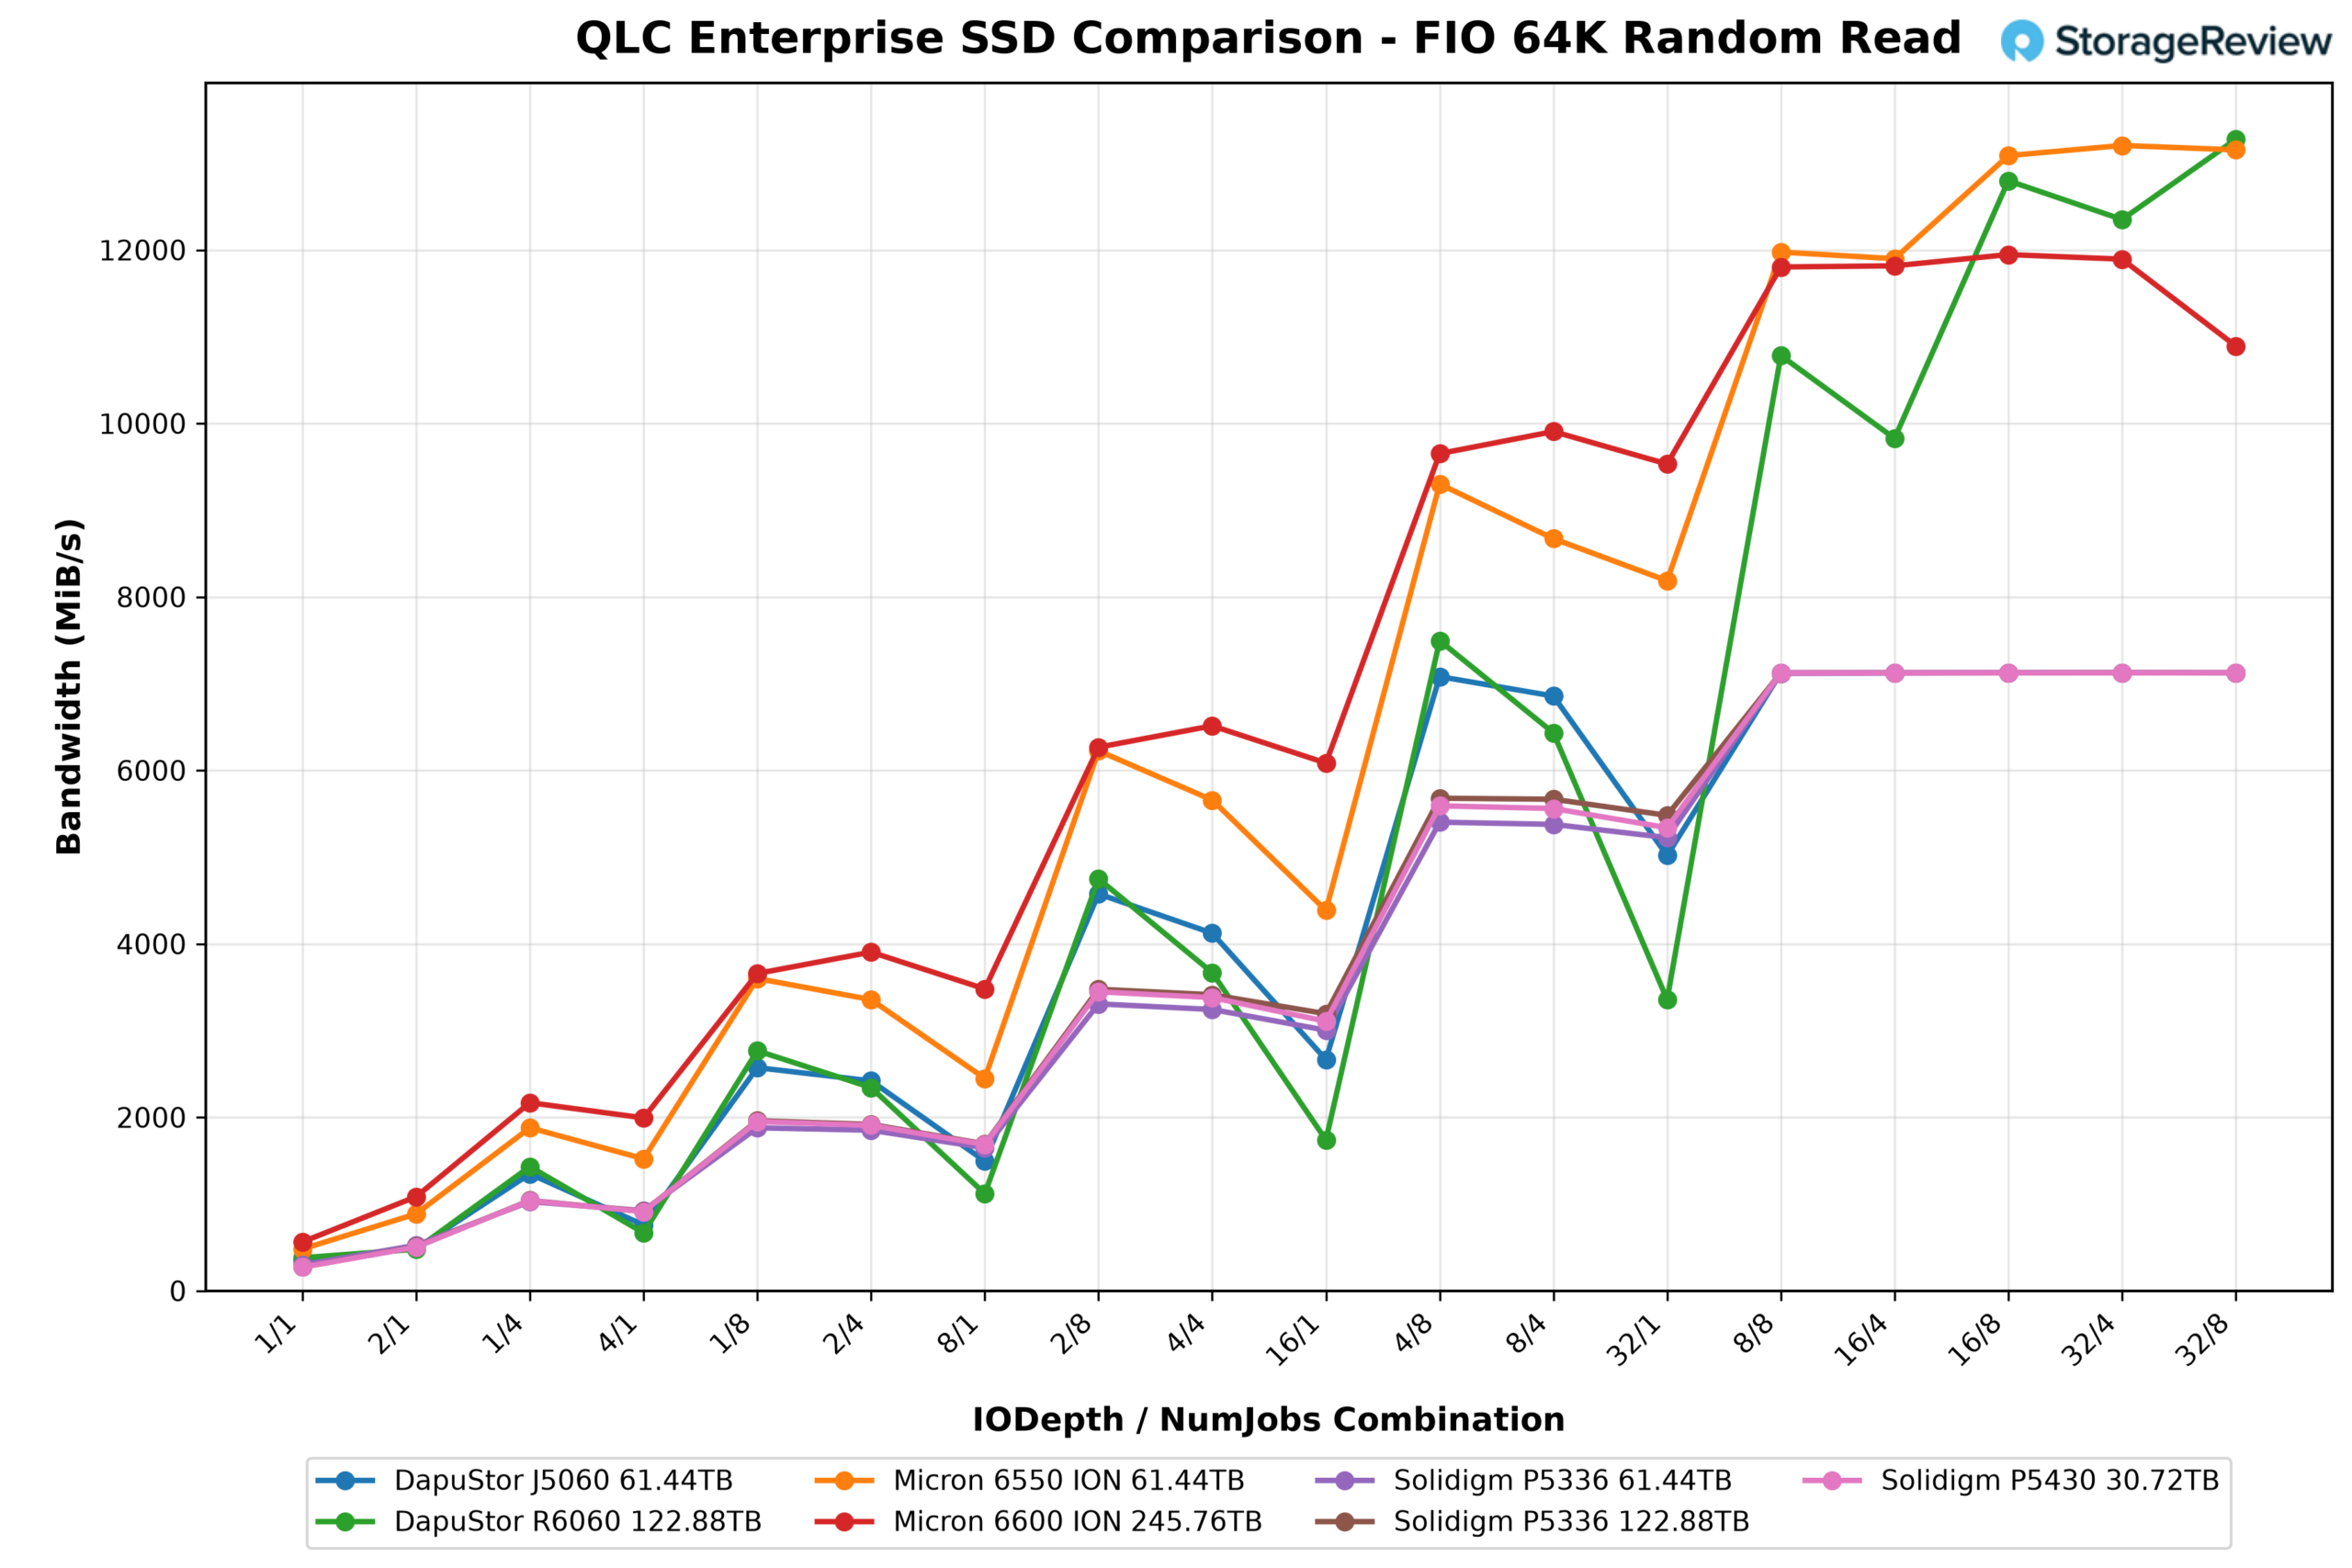
64K Random Read
The P5430 climbed from 273.3MB/s and 4.4K IOPS at 1/1 through 1,038.8MB/s at 1/4, 1,951.8MB/s at 1/8, 3,447.6MB/s at 2/8, and 5,591.4MB/s at 4/8, then hit the Gen4 wall at 7,124.8MB/s and 114.0K IOPS at 8/8 and stayed there, within 1MB/s, for the last five points of the sweep. The three other Gen4 drives, the J5060 and both P5336s, topped out at the same 7,125MB/s, and the Gen5 drives cleared it by a wide margin: the R6060 at 13,274.8MB/s, the 6550 ION at 13,204.6MB/s, and the 6600 ION at 11,946.5MB/s.
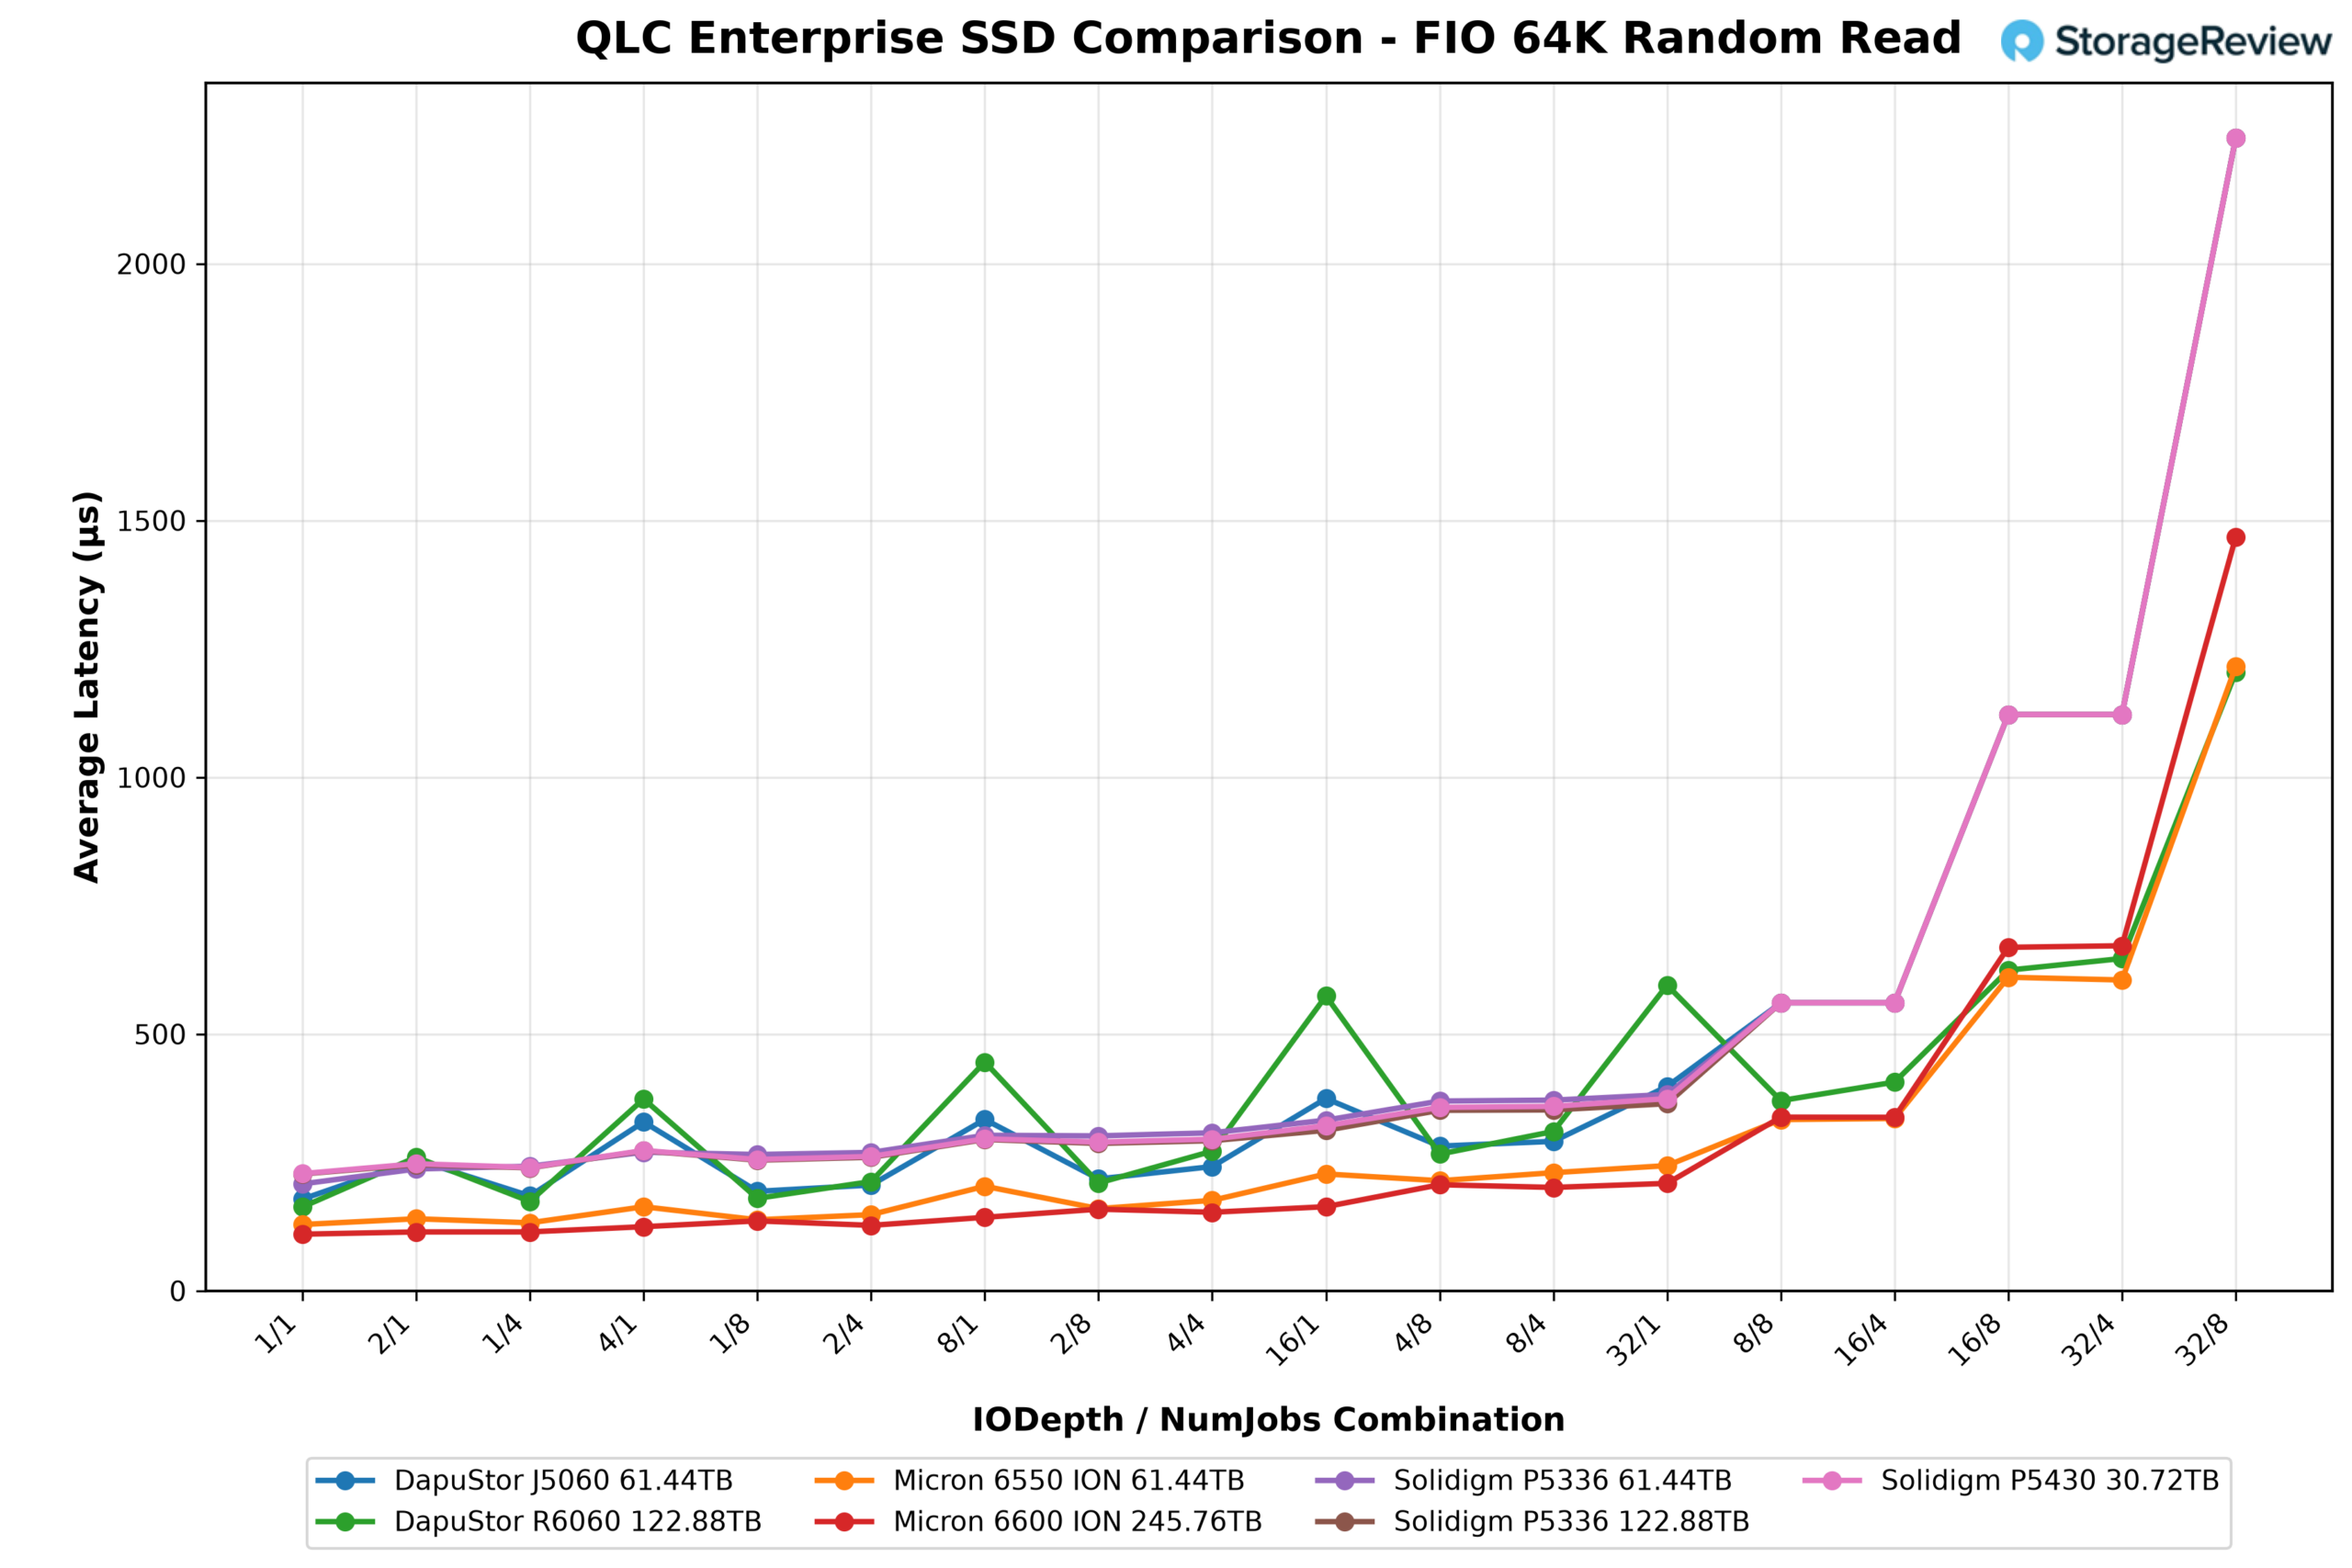
64K Random Read Latency
Read latency for the P5430 started at 228.2µs at 1/1 and stayed between 240µs and 296µs through the eight-outstanding points, then rose to 290µs to 321µs at 16 outstanding, 357µs to 374µs at 32 outstanding, 560.9µs at 64 outstanding, 1,122µs at 128 outstanding, and 2,244.9µs at 32/8 once the drive was bandwidth-bound. The J5060 and both P5336 drives ended within 1µs of the same 2,245µs figure, since all four are saturating the same link; the Gen5 drives finished between 1,204.5µs for the R6060 and 1,467.8µs for the 6600 ION. At the light end, the P5430’s 228.2µs was among the slowest first-access figures in the group, alongside the P5336 122.88TB at 227.5µs, with the 6600 ION quickest at 110.3µs.
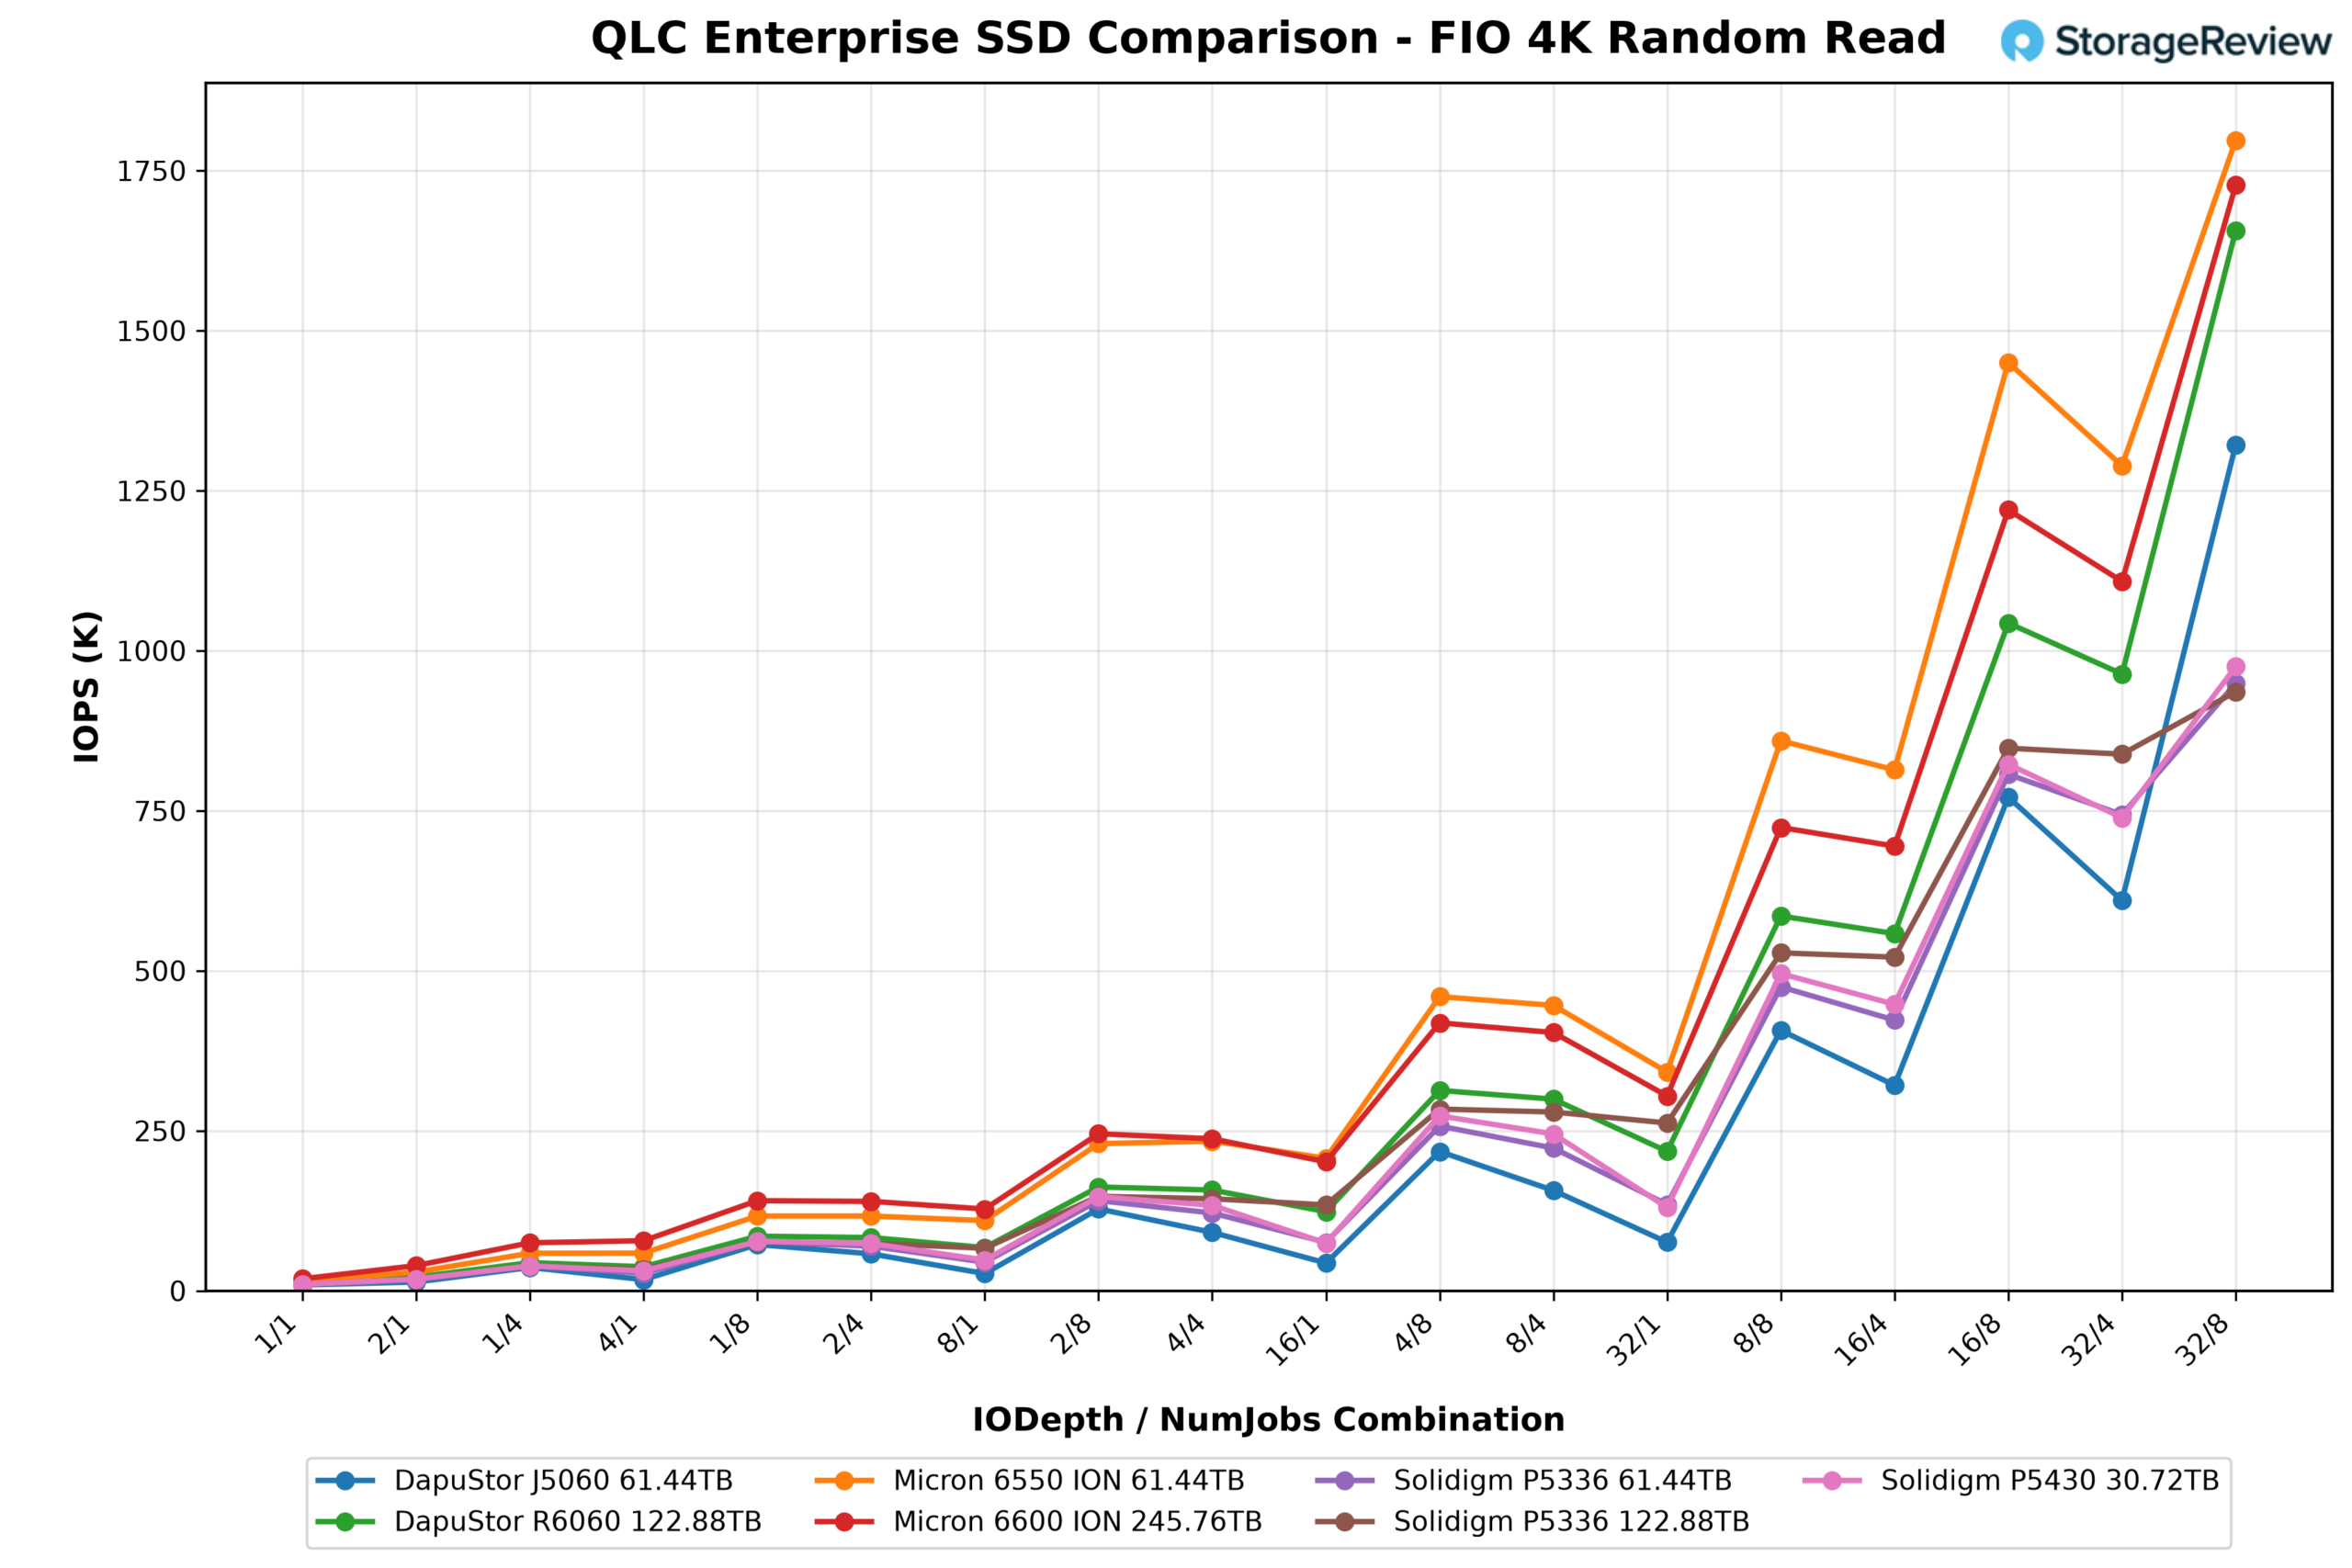
4K Random Read
The P5430 scaled from 10.0K IOPS at 1/1 to 77.1K at 1/8, 147.0K at 2/8, 273.3K at 4/8, 495.5K at 8/8, and 822.6K at 16/8, then peaked at 975.2K IOPS and 3,809.2MB/s at 32/8. That peak is above Solidigm’s 934.5K rating for the 30.72TB model, and it beat both P5336 drives, at 948.9K for the 61.44TB and 935.8K for the 122.88TB. The single-job points scaled far more slowly, reaching only 130.2K at 32/1, so the drive needs parallel jobs to reach its rating. The Gen5 drives and the J5060 went well past it at 32/8: the 6550 ION at 1.797M, the 6600 ION at 1.727M, the R6060 at 1.656M, and the J5060 at 1.322M.
4K Random Read Latency
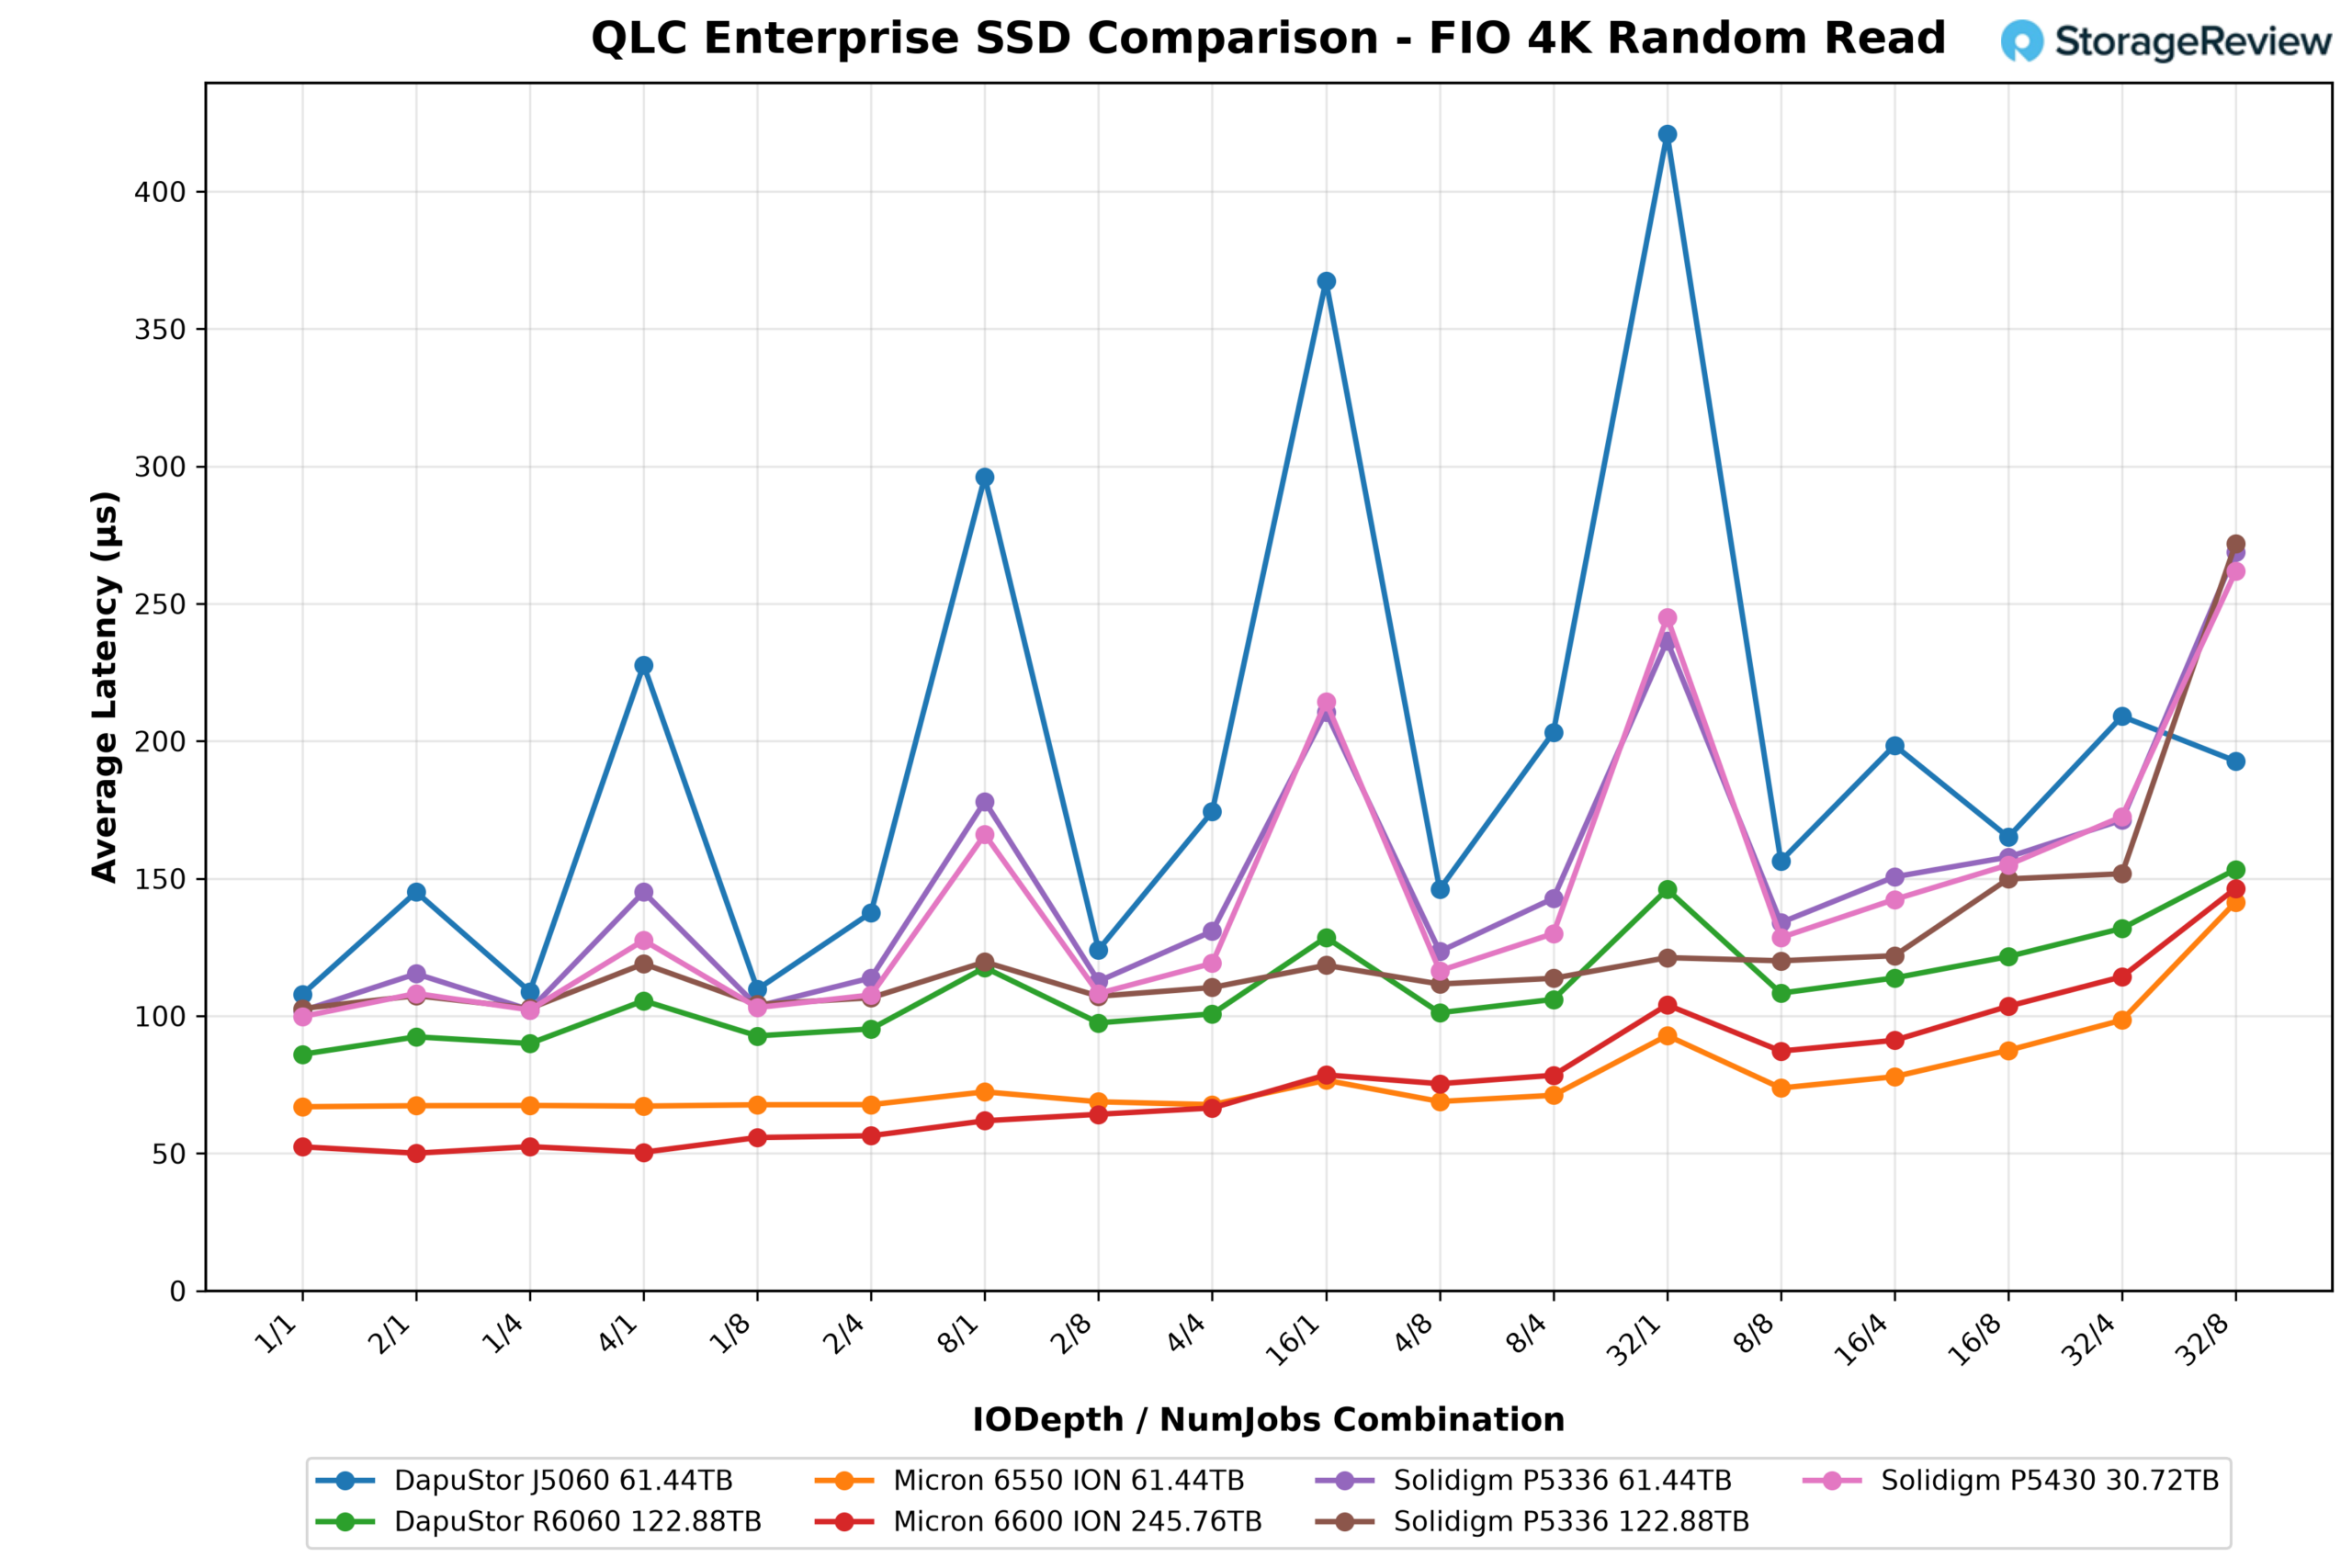
The P5430’s 4K read latency was 99.8µs at 1/1 and stayed between 102µs and 130µs on the multi-job points through 8/8, while the single-job deep-queue points at 8/1, 16/1, and 32/1 ranged from 166µs to 245µs. It rose to 142.4µs at 16/4, 155.0µs at 16/8, 172.6µs at 32/4, and 261.8µs at 32/8 as the drive approached its IOPS ceiling. The two P5336 drives followed the same curve within a few microseconds and ended at 268.8µs and 272.0µs at 32/8. The 6600 ION had the lowest first-access figure at 52.4µs and the 6550 ION the lowest at the top end at 141.5µs.
4K Random Write
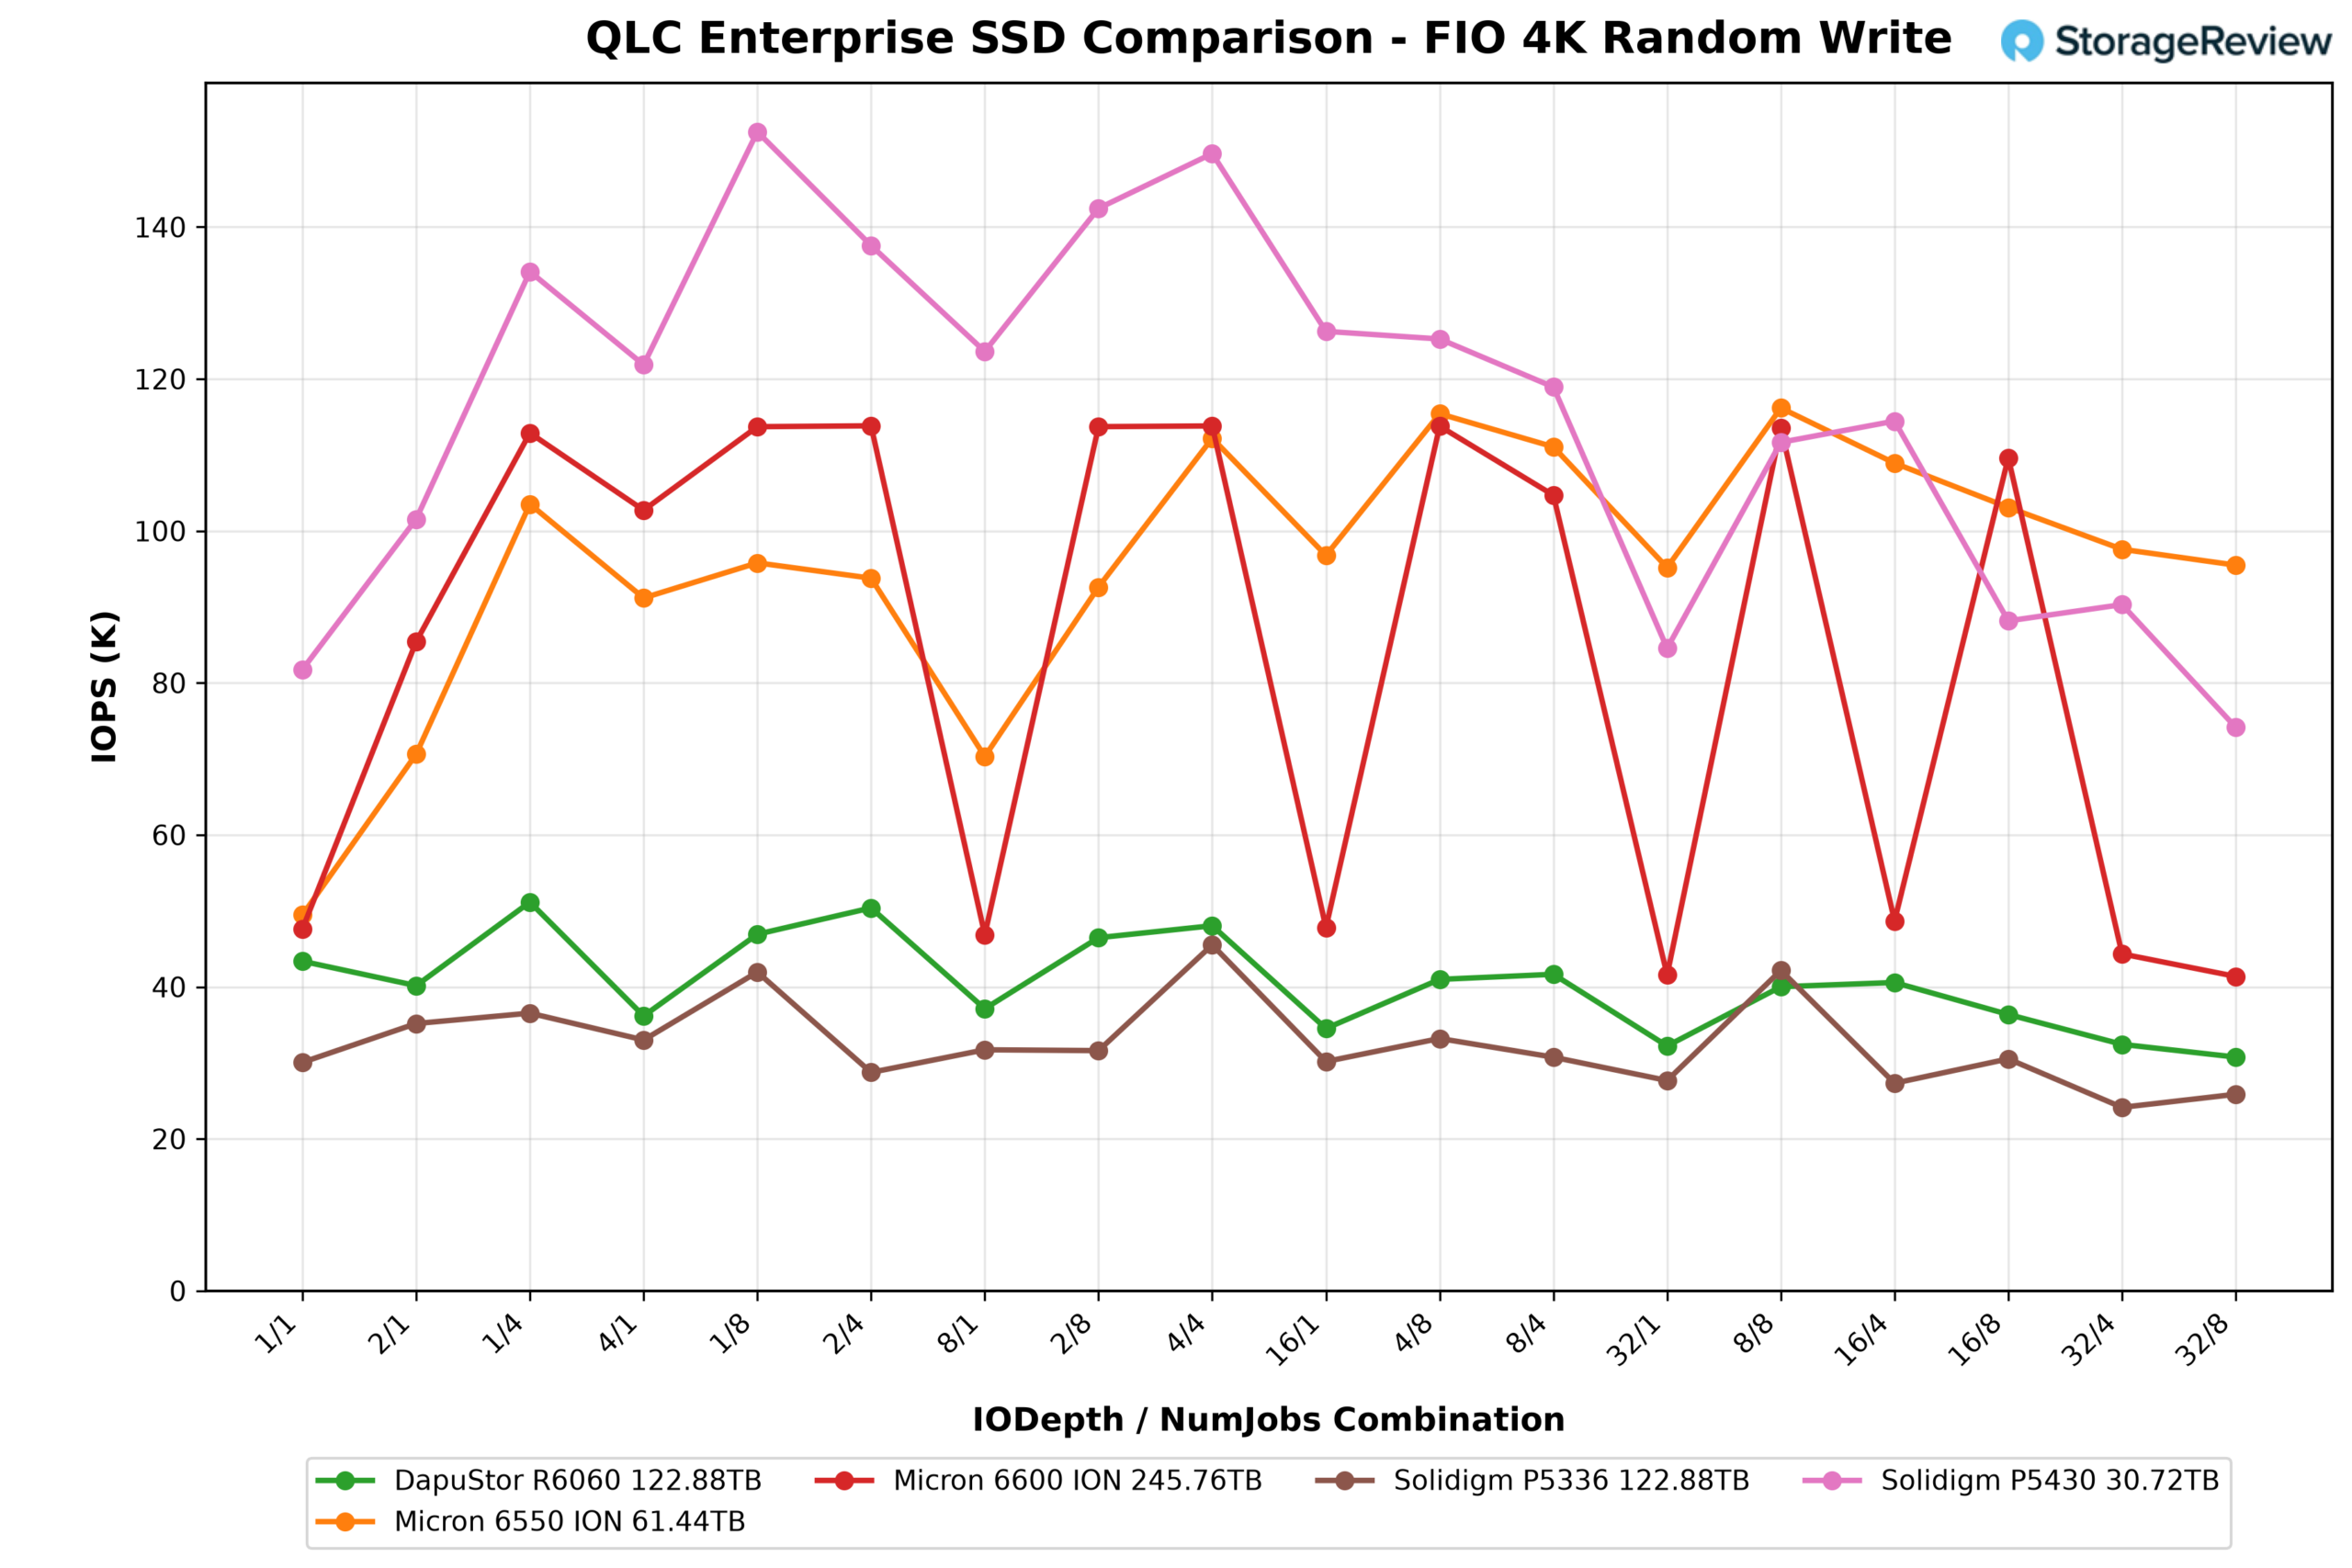
The P5430 opened the 4K random write sweep at 81.8K IOPS at 1/1 with 11.8µs of latency, climbed to 134.1K at 1/4, and peaked at 152.5K IOPS and 595.8MB/s at 1/8. After that peak, it held between 111.7K and 149.7K on every remaining combination up to 64 outstanding I/Os, except for a dip to 84.6K on the single-job 32/1 point, and settled at 88.2K at 16/8, 90.3K at 32/4, and 74.2K at 32/8 once 128 or more writes were outstanding. Solidigm rates the drive at 120K, and the P5430 cleared that on nine of the 18 points, all of them between four and 32 outstanding I/Os. It stayed within 7 percent of the rating at 64 outstanding and fell 25 to 38 percent below it at the two deepest queue levels.
The closest QLC drive, the 6600 ION, peaked at 113.8K but oscillated between 41K and 114K across the sweep and finished at 41.4K; the R6060 peaked at 51.2K and finished at 30.8K; the P5336 122.88TB peaked at 45.5K and finished at 25.9K. The TLC 6550 ION was the only drive in the same range, at a 116.2K peak and 95.5K at 32/8. The J5060 and the P5336 61.44TB didn’t complete the 4K random write test when this group was originally run, so they’re absent from this chart.
4K Random Write Latency
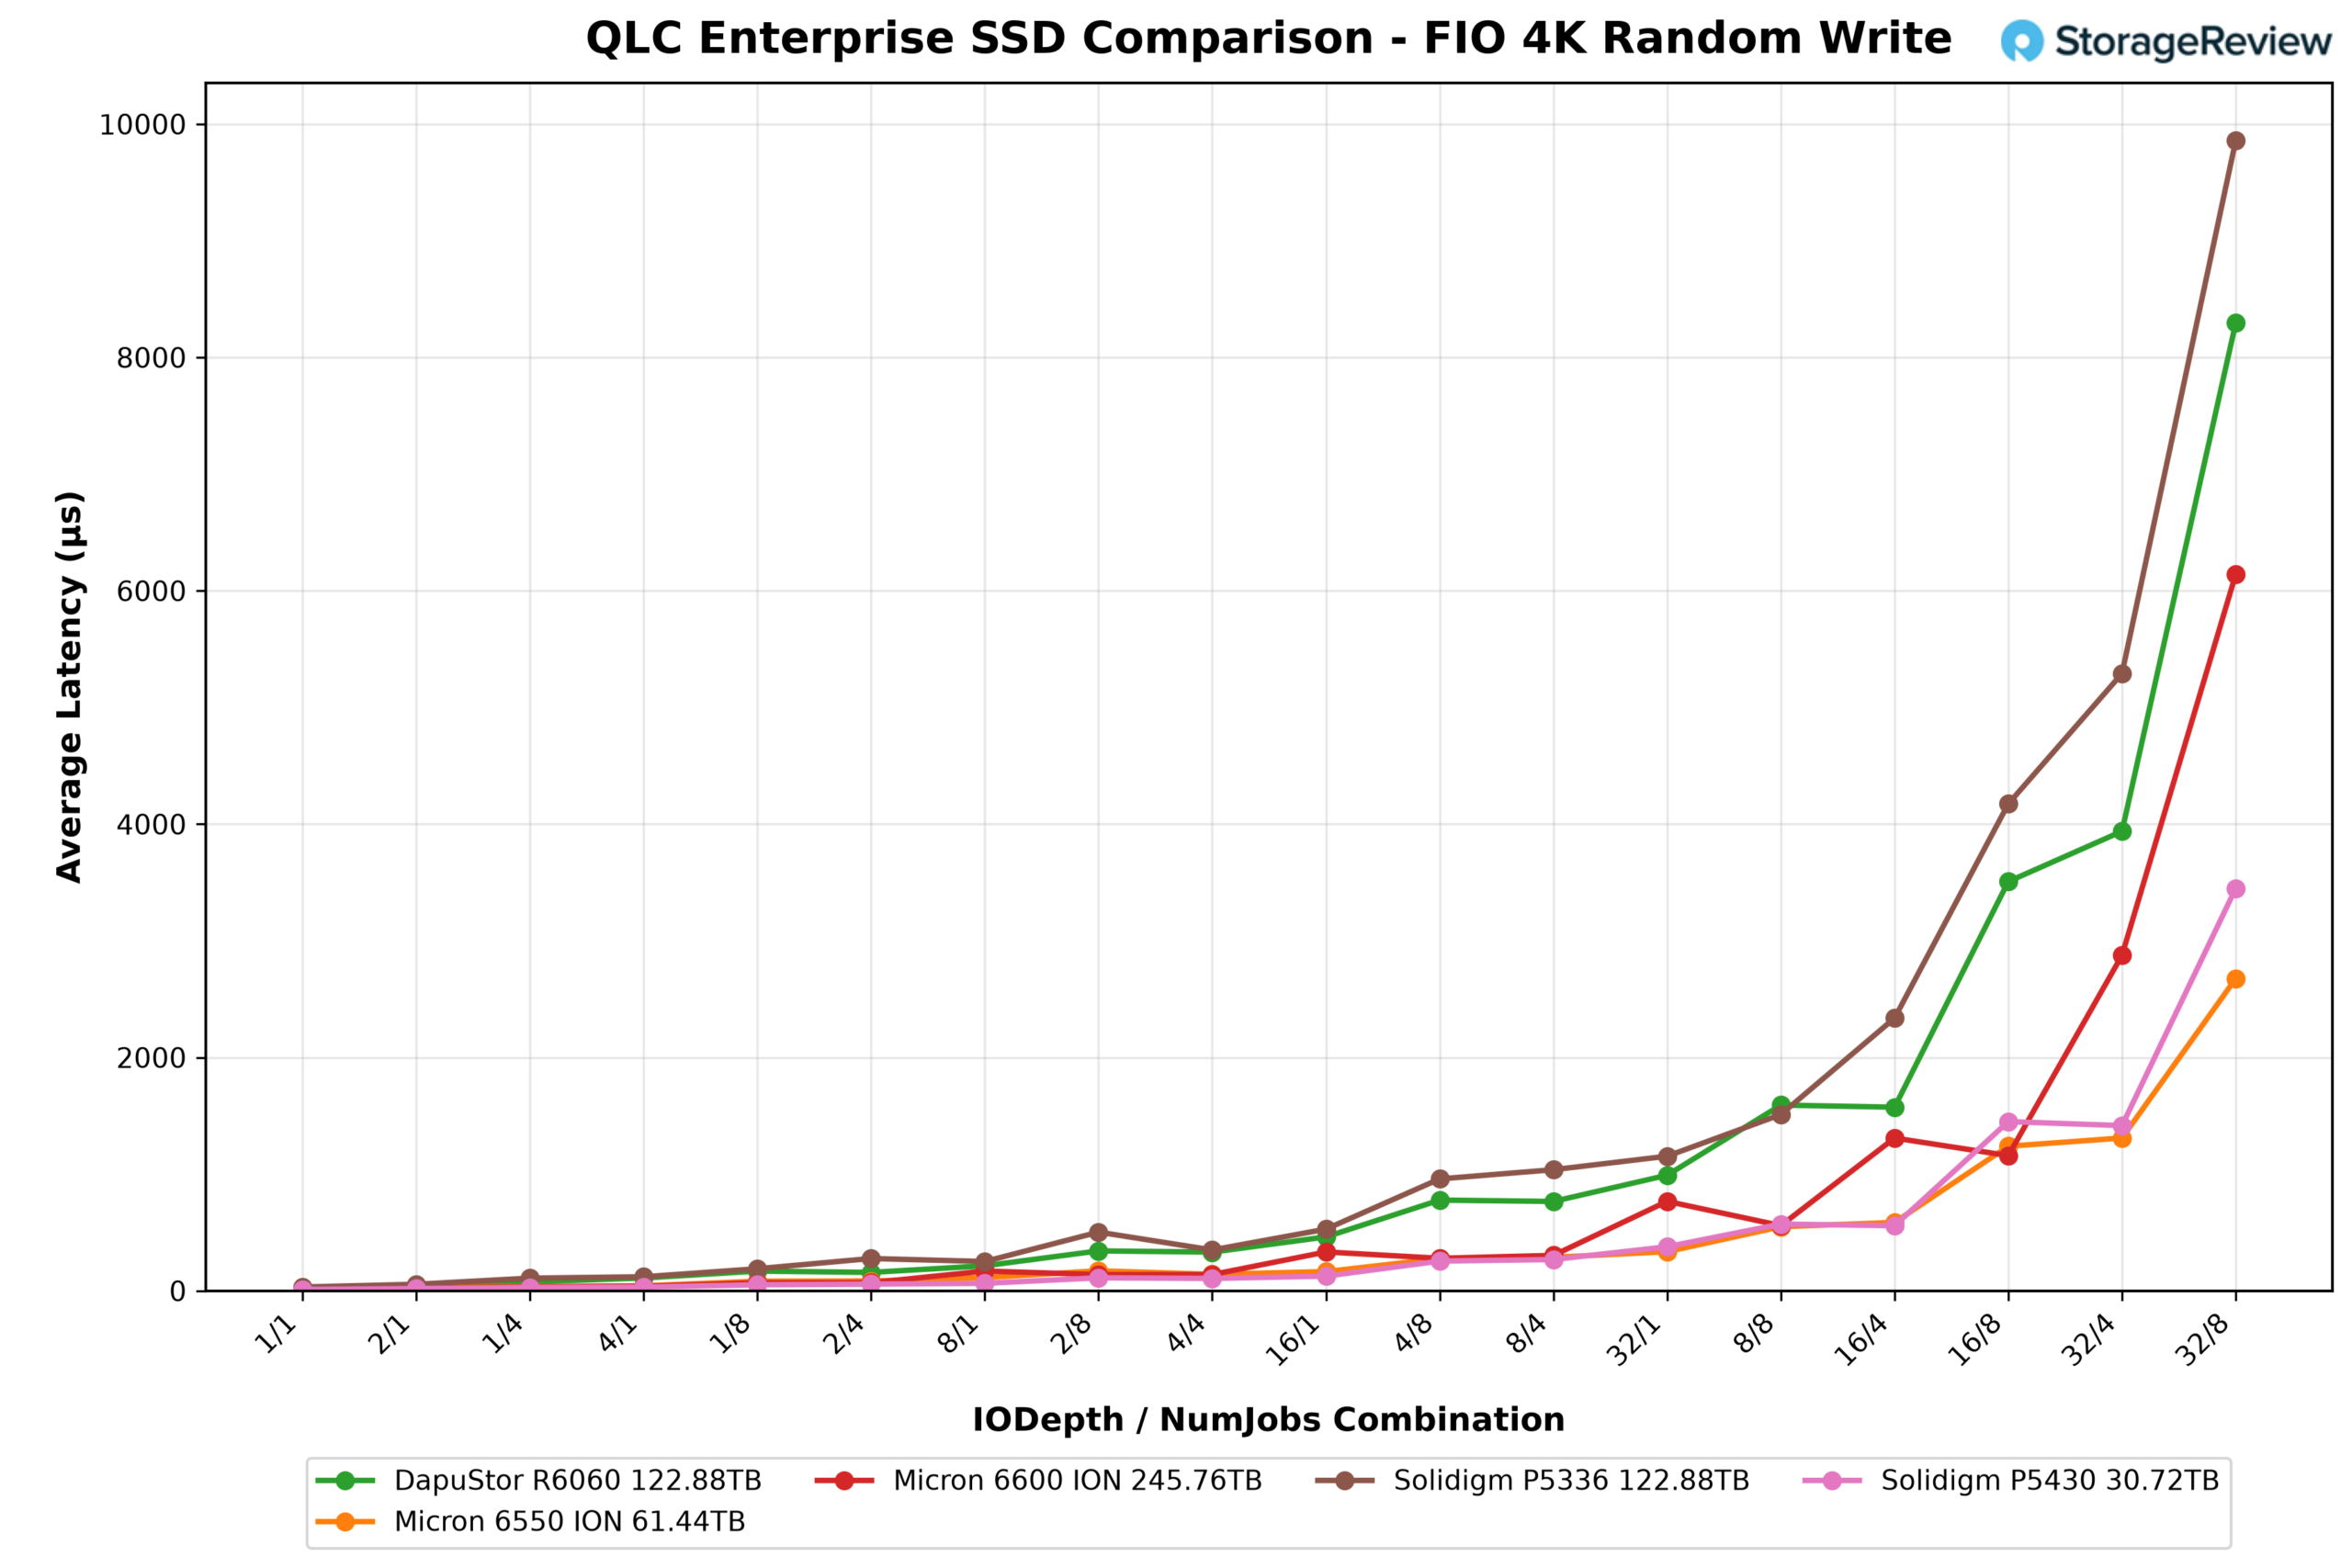
Latency stayed at 11.8µs at 1/1, 19.2µs at 2/1, 29.3µs at 1/4, 51.8µs at 1/8, and 106µs to 126µs at 16 outstanding, then rose with queue depth to 255µs to 378µs at 32, 558µs to 572µs at 64, 1,416µs to 1,450µs at 128, and 3,449.4µs at 32/8. That final figure compares with 2,676.6µs for the 6550 ION, 6,141.0µs for the 6600 ION, 8,295.3µs for the R6060, and 9,859.8µs for the P5336 122.88TB.
GPU Direct Storage
One of the tests we conducted on this testbench was the Magnum IO GPU Direct Storage (GDS) test. GDS is a feature developed by NVIDIA that allows GPUs to bypass the CPU when accessing data stored on NVMe drives or other high-speed storage devices. GDS moves data directly between the storage device and GPU memory without staging it in system memory, reducing latency and increasing throughput.
Traditionally, when a GPU processes data stored on an NVMe drive, the data must first travel through the CPU and system memory before reaching the GPU. This process introduces bottlenecks, as the CPU acts as an intermediary, adding latency and consuming CPU cycles and memory bandwidth. GPU Direct Storage removes that hop by letting the GPU access data directly from the storage device via the PCIe bus, and for AI workloads that stream terabytes through a training or inference pipeline, that direct path is what keeps GPUs from sitting idle on I/O. Our GDSIO sweep runs sequential reads and writes at transfer sizes of 16K, 128K, and 1M across 1 to 128 threads, and we report throughput, IOPS, and average latency for each point.
GDSIO Sequential Read Throughput
The P5430’s read curve has the shape we’ve come to expect from Solidigm’s QLC controllers: uneven at 16K, then a clean climb once the transfer size grows. At 16K, it opened at 537MiB/s on a single thread, dropped to 166MiB/s at four threads and 179MiB/s at eight, then recovered to 345MiB/s at 16, 501MiB/s at 32, and 808MiB/s at 64, finishing at 1.1GiB/s on 128 threads. That single-thread dip and recovery is the same pattern the P5336 drives and both DapuStors showed in the small-block section, and it left the P5430 in the middle of the group at 16K, well behind the Micron 6600 ION’s 1.9GiB/s at the top end but ahead of the two DapuStors and level with the 6550 ION through the mid-thread range.
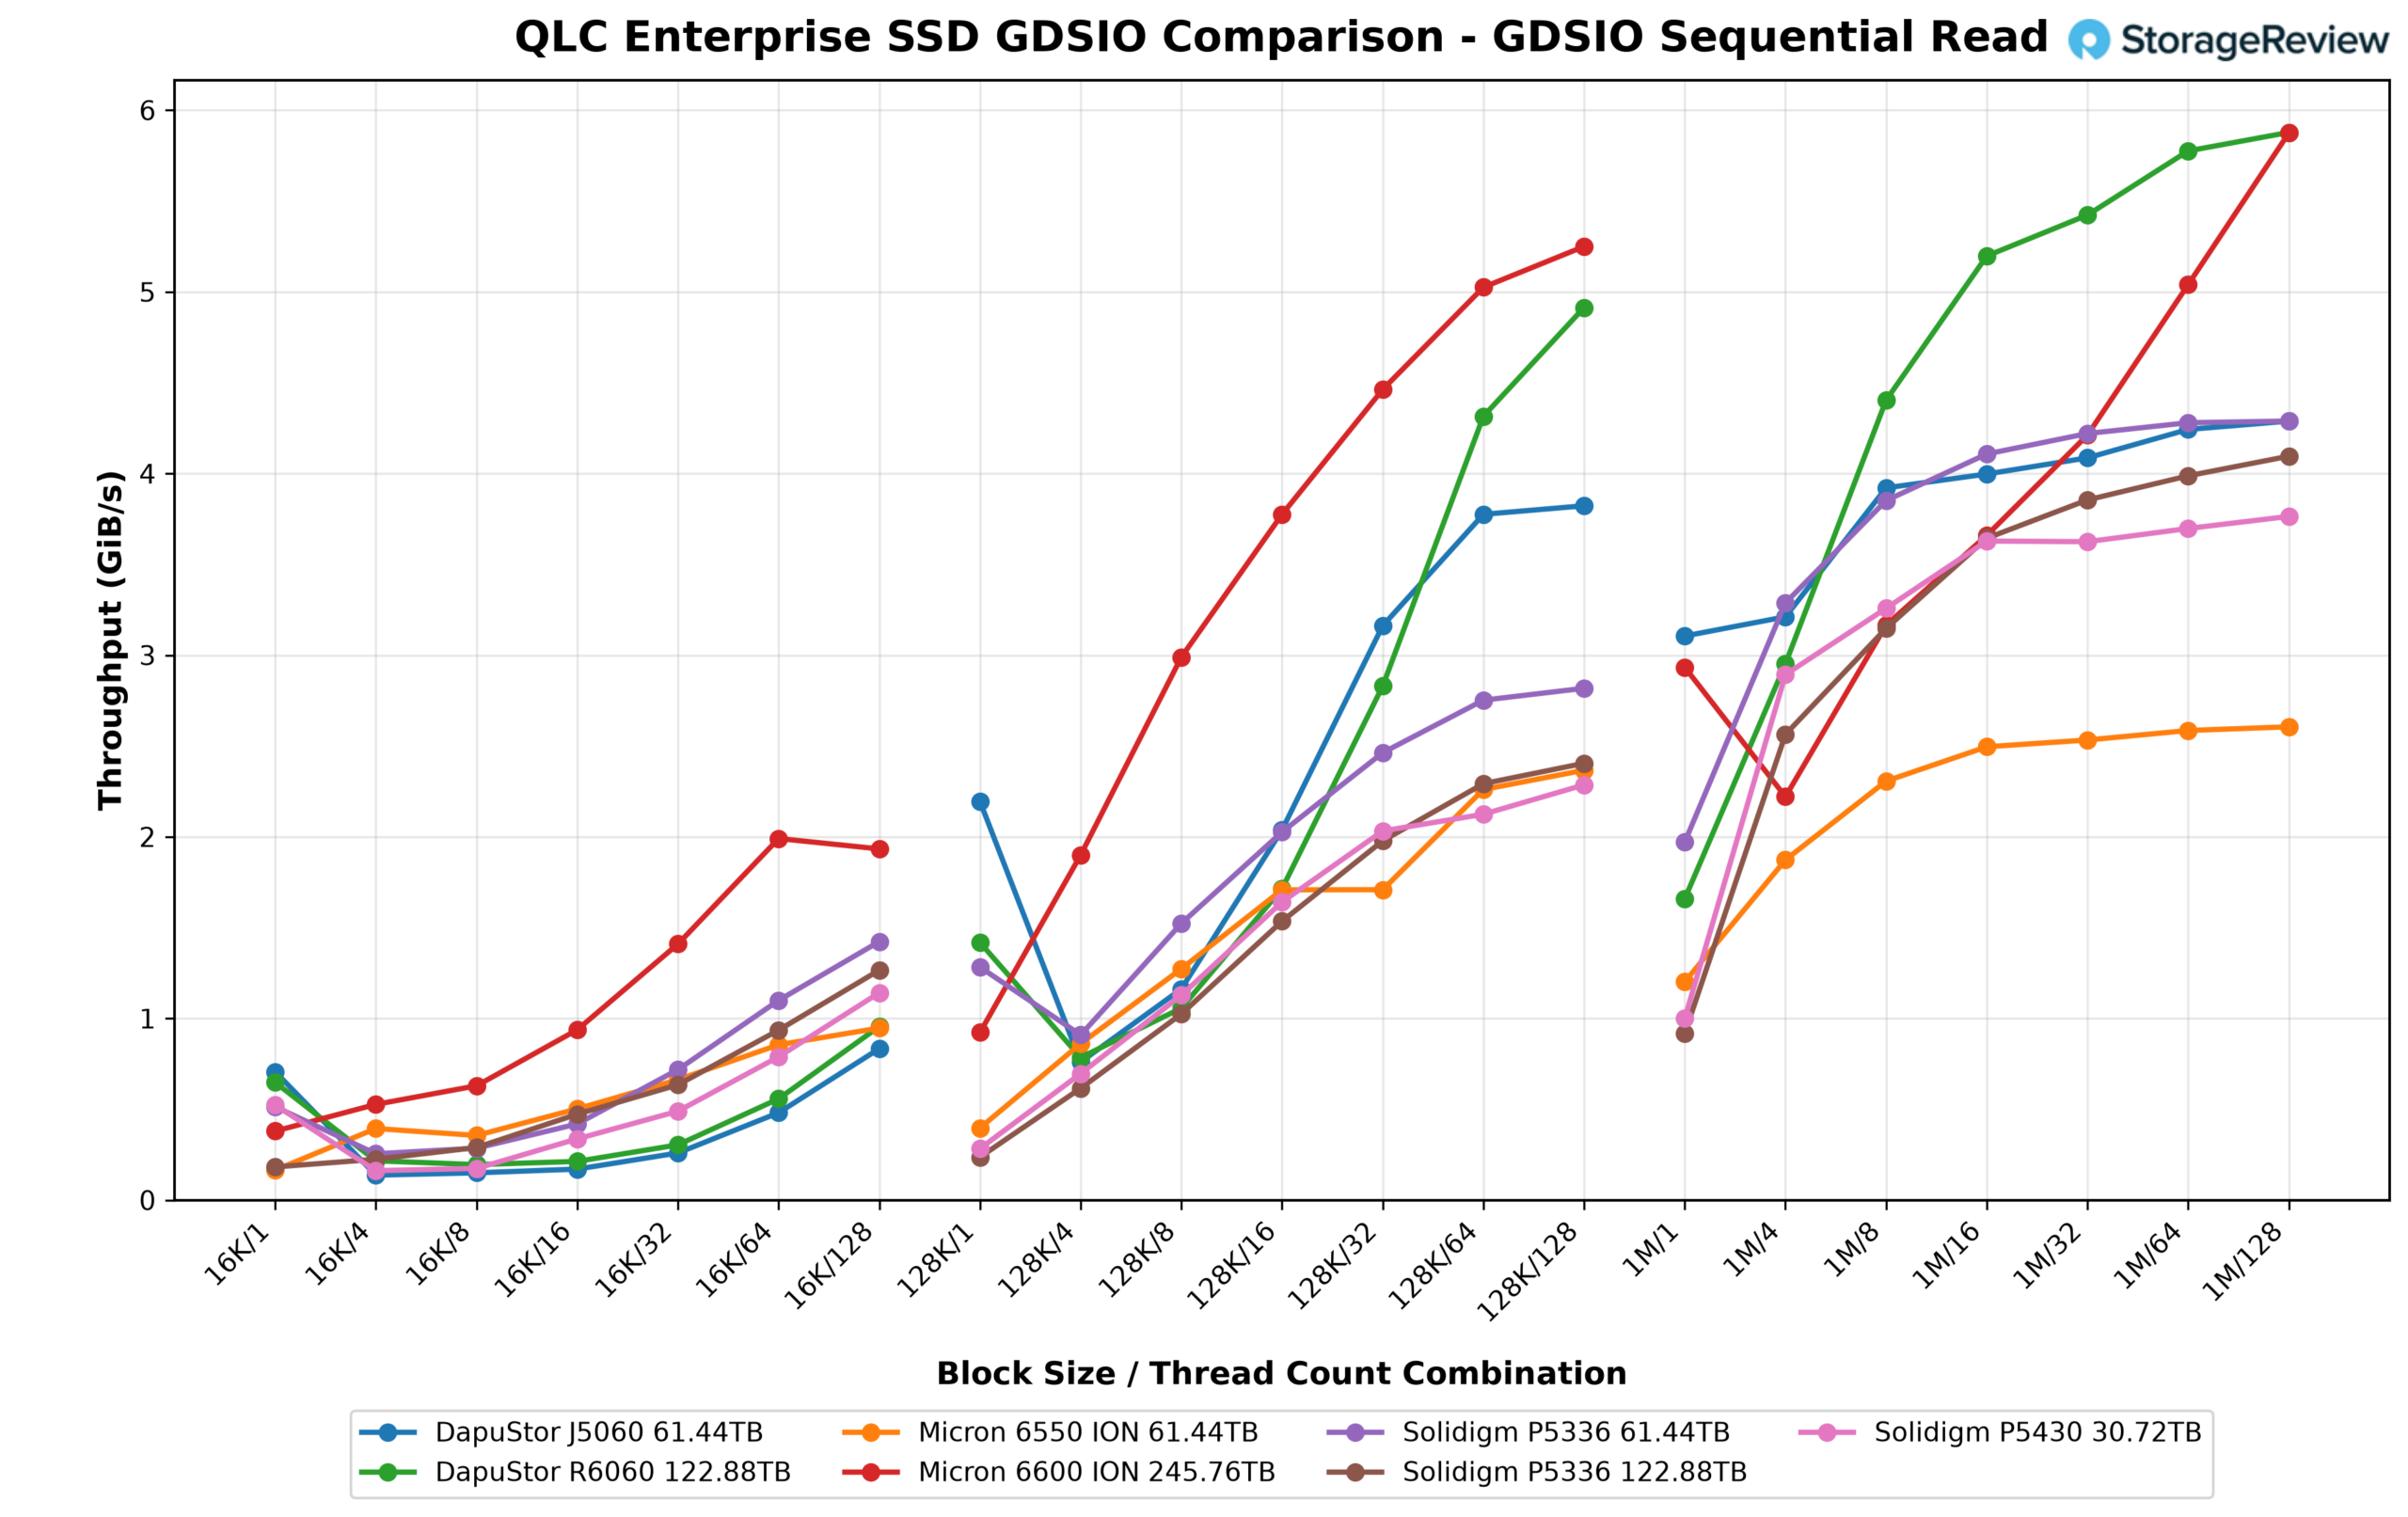
At 128K, the P5430 moved from 290MiB/s with one thread to 713MiB/s with four, 1.1GiB/s with eight, 1.6GiB/s with 16, 2.0GiB/s with 32, 2.1GiB/s with 64, and 2.3GiB/s with 128. That tracked the P5336 122.88TB almost point-for-point and finished on par with the 6550 ION, but the Gen5 drives pulled away here: the 6600 ION reached 5.3GiB/s, the R6060 4.9GiB/s, and the J5060 3.8GiB/s at 128 threads, with the P5336 61.44TB at 2.8GiB/s.
The 1M results are where the P5430’s Gen4 link shows its ceiling. It started at 1.0GiB/s on one thread, jumped to 2.9GiB/s at four and 3.3GiB/s at eight, then flattened at 3.6GiB/s from 16 threads, 3.7GiB/s at 64, and 3.8GiB/s at 128. The plateau from 16 threads onward is the drive running out of bus, and it puts the P5430 in a tight cluster with the three other Gen4 drives: the P5336 122.88TB at 4.1GiB/s and the P5336 61.44TB and J5060 at 4.3GiB/s. The Gen5 pair at the top separated cleanly, with the R6060 and the 6600 ION both at 5.9GiB/s, while the TLC 6550 ION trailed the group at 2.6GiB/s in this test. On a large-block GPU read stream, the P5430 delivers roughly 90 percent of what the larger Gen4 QLC drives do and about two-thirds of the Gen5 leaders.
GDSIO Sequential Read IOPS
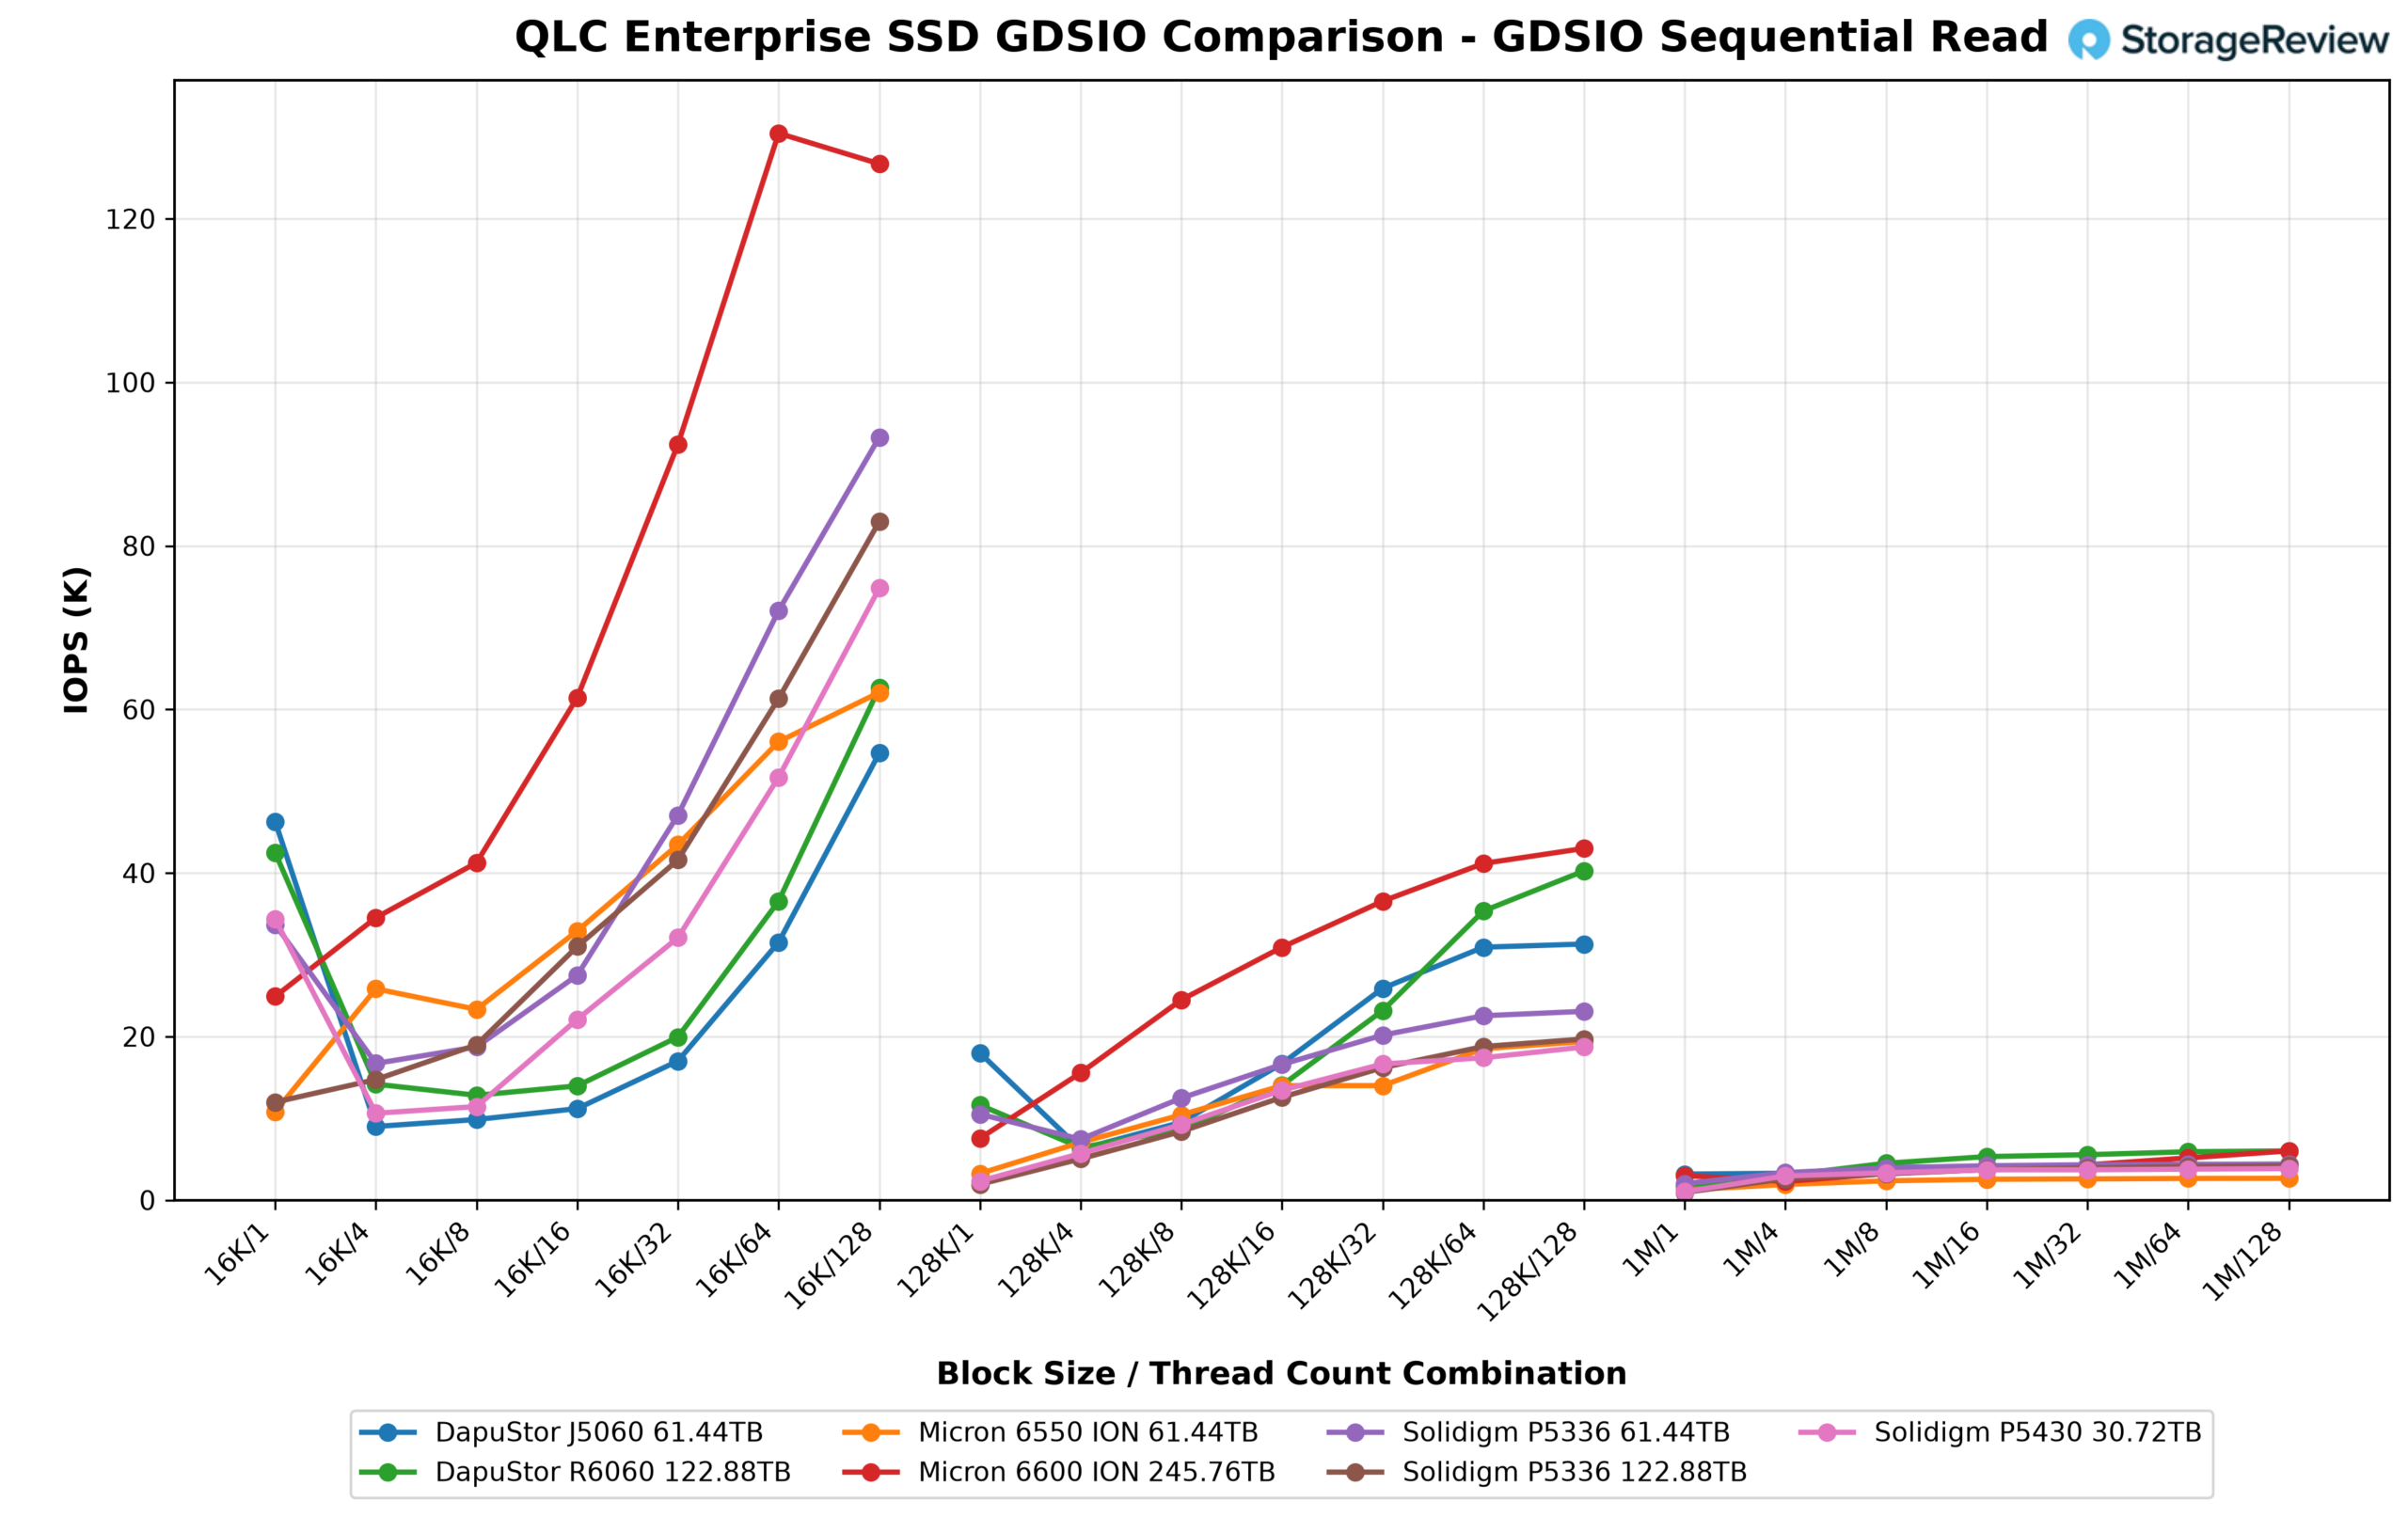
The P5430 peaked at 74.8K IOPS on the 16K workload at 128 threads, which placed it fourth in the group behind the 6600 ION at 130.4K, the P5336 61.44TB at 93.3K, and the P5336 122.88TB at 83.0K, and ahead of the R6060 at 62.6K, the 6550 ION at 62.1K, and the J5060 at 54.7K. The 128K and 1M IOPS curves follow the throughput plateaus above, with the P5430 leveling just under 19K IOPS at 128K and about 3.8K IOPS at 1M once the Gen4 link saturates.
GDSIO Sequential Read Latency
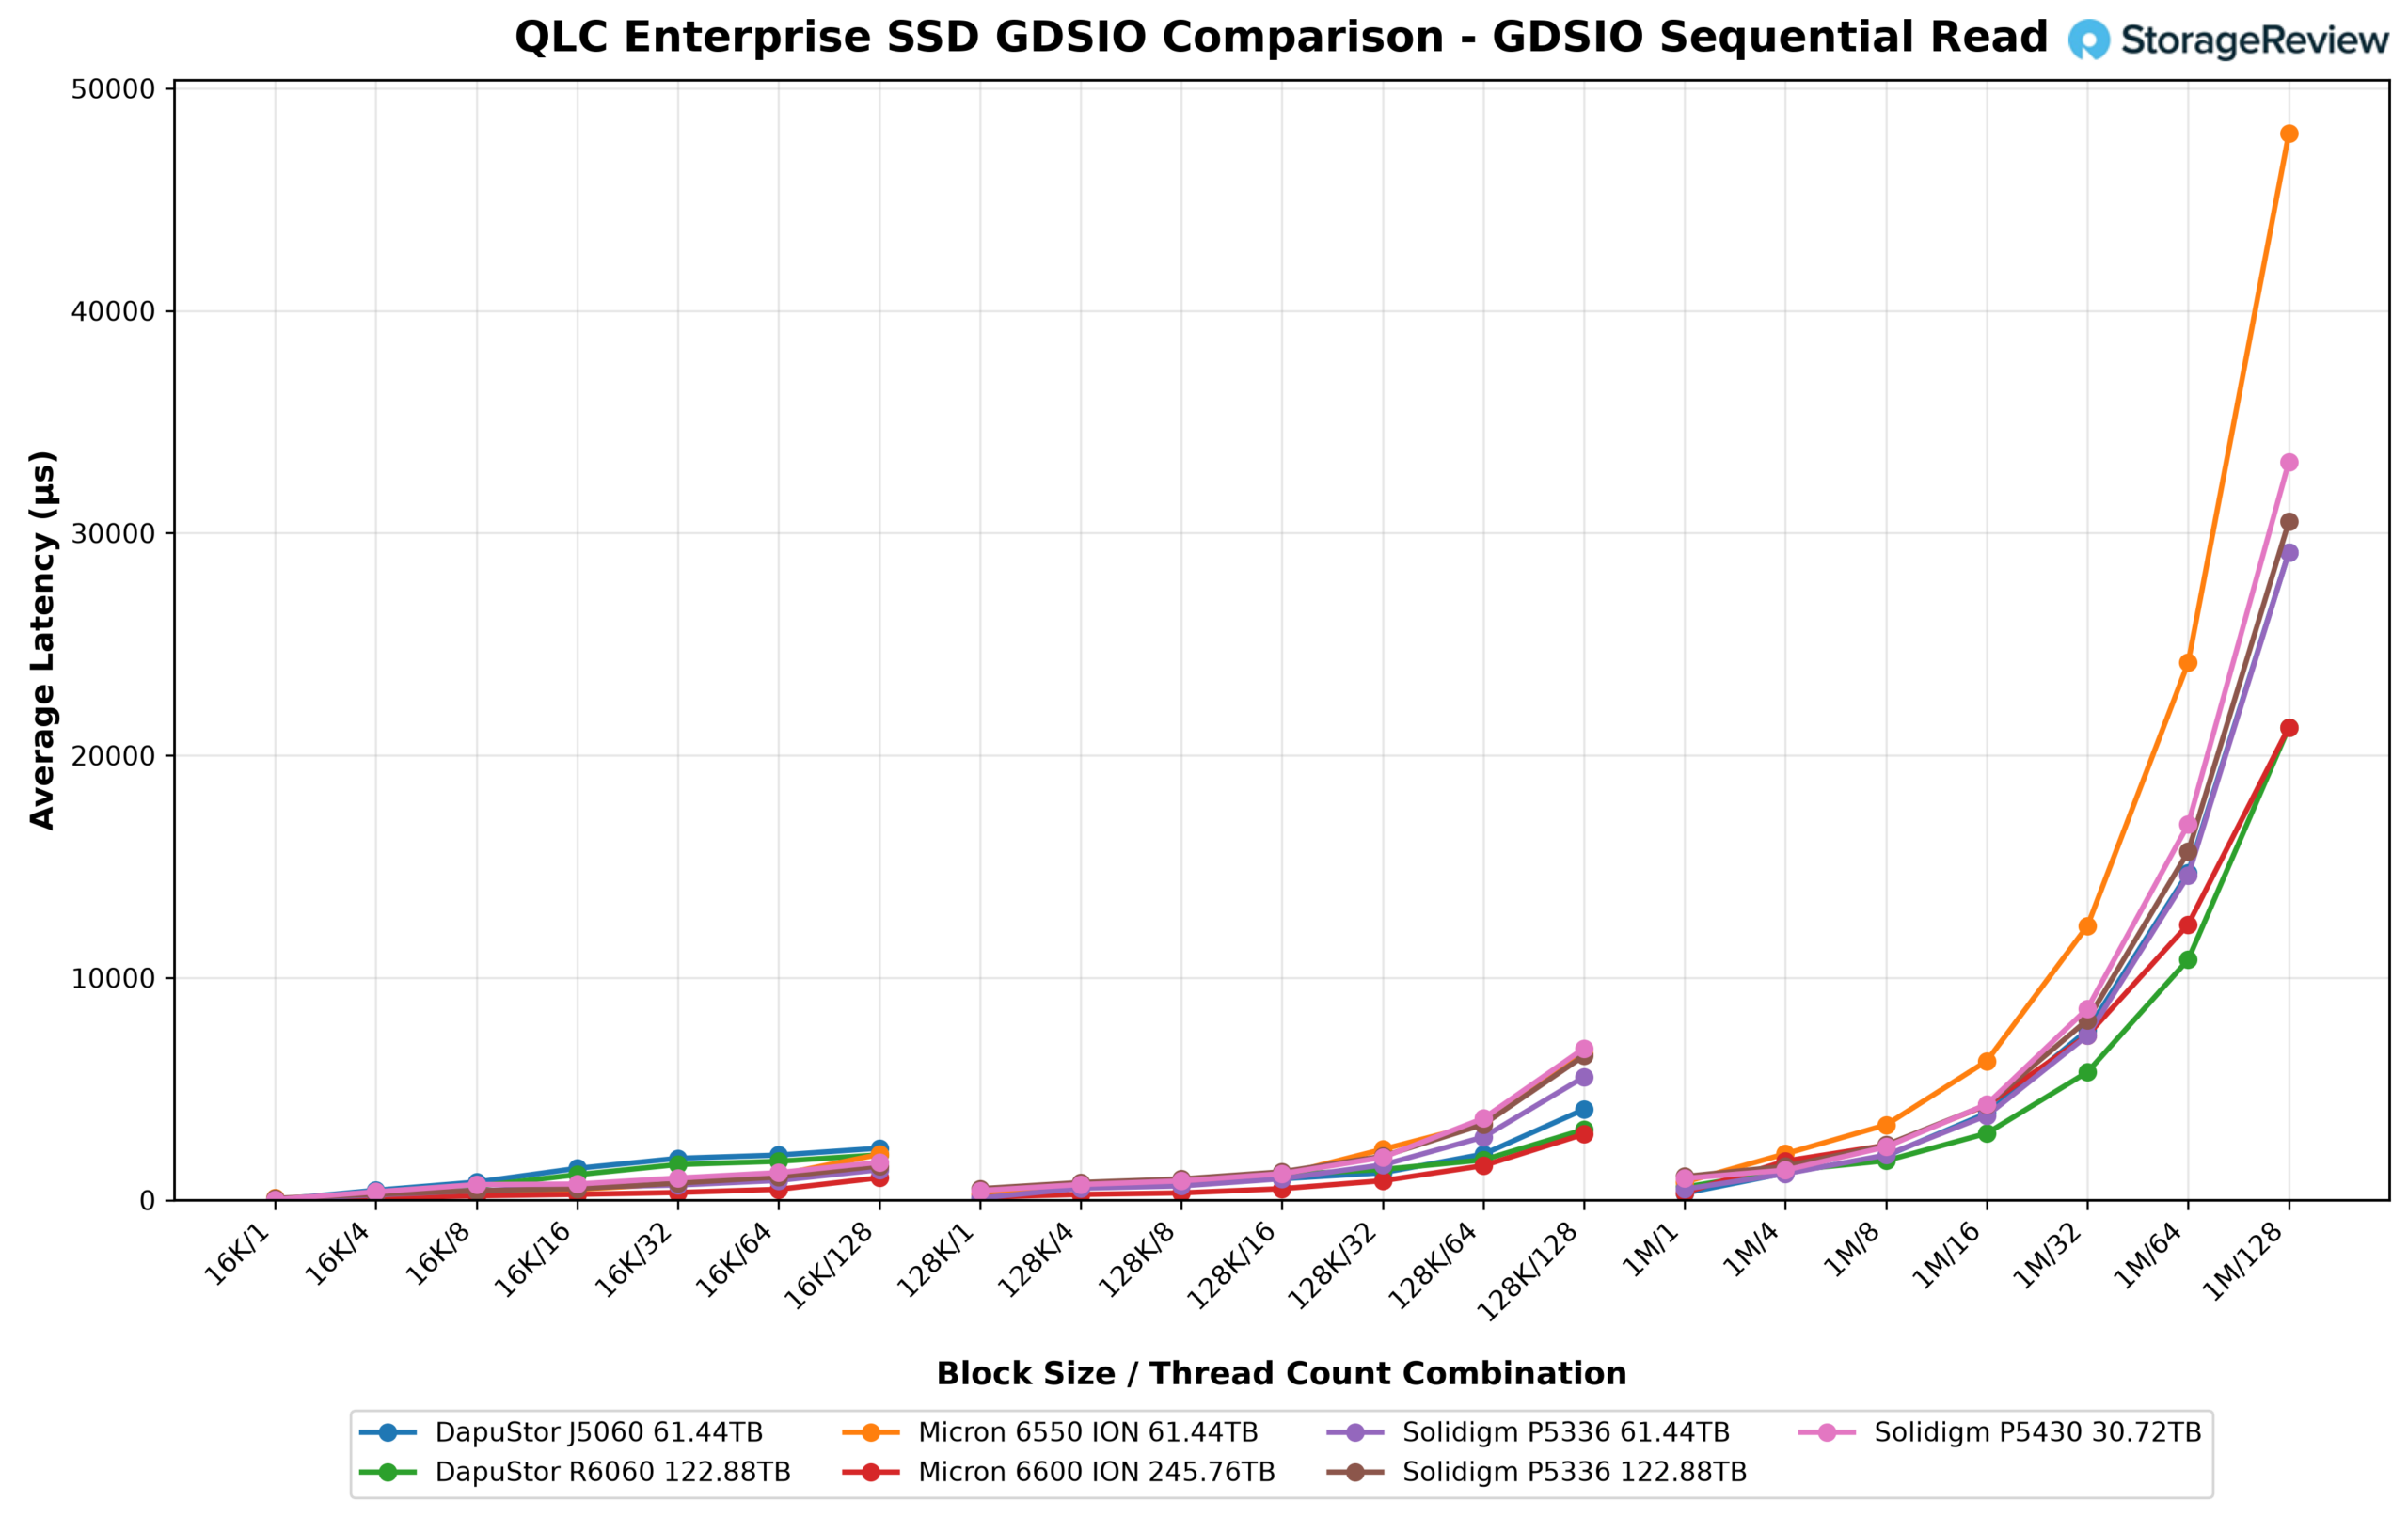
At the light end of the sweep, the P5430’s single-thread 16K read latency of 27.8µs trailed only the two DapuStors, at 20.2µs for the J5060 and 22.1µs for the R6060, and edged the P5336 61.44TB at 28.4µs. The 6600 ION sat at 38.6µs, and the two drives that struggled at QD1 were the P5336 122.88TB at 82.1µs and the 6550 ION at 90.9µs, both of which pay a first-access penalty the P5430 doesn’t. As thread counts climbed, latency rose with queue depth, as it does for every drive in the group, and at 1M and 128 threads, the P5430 ended up around 33ms, above the Gen5 drives at 21ms but below the 6550 ION’s 48ms and in line with the two P5336 drives.
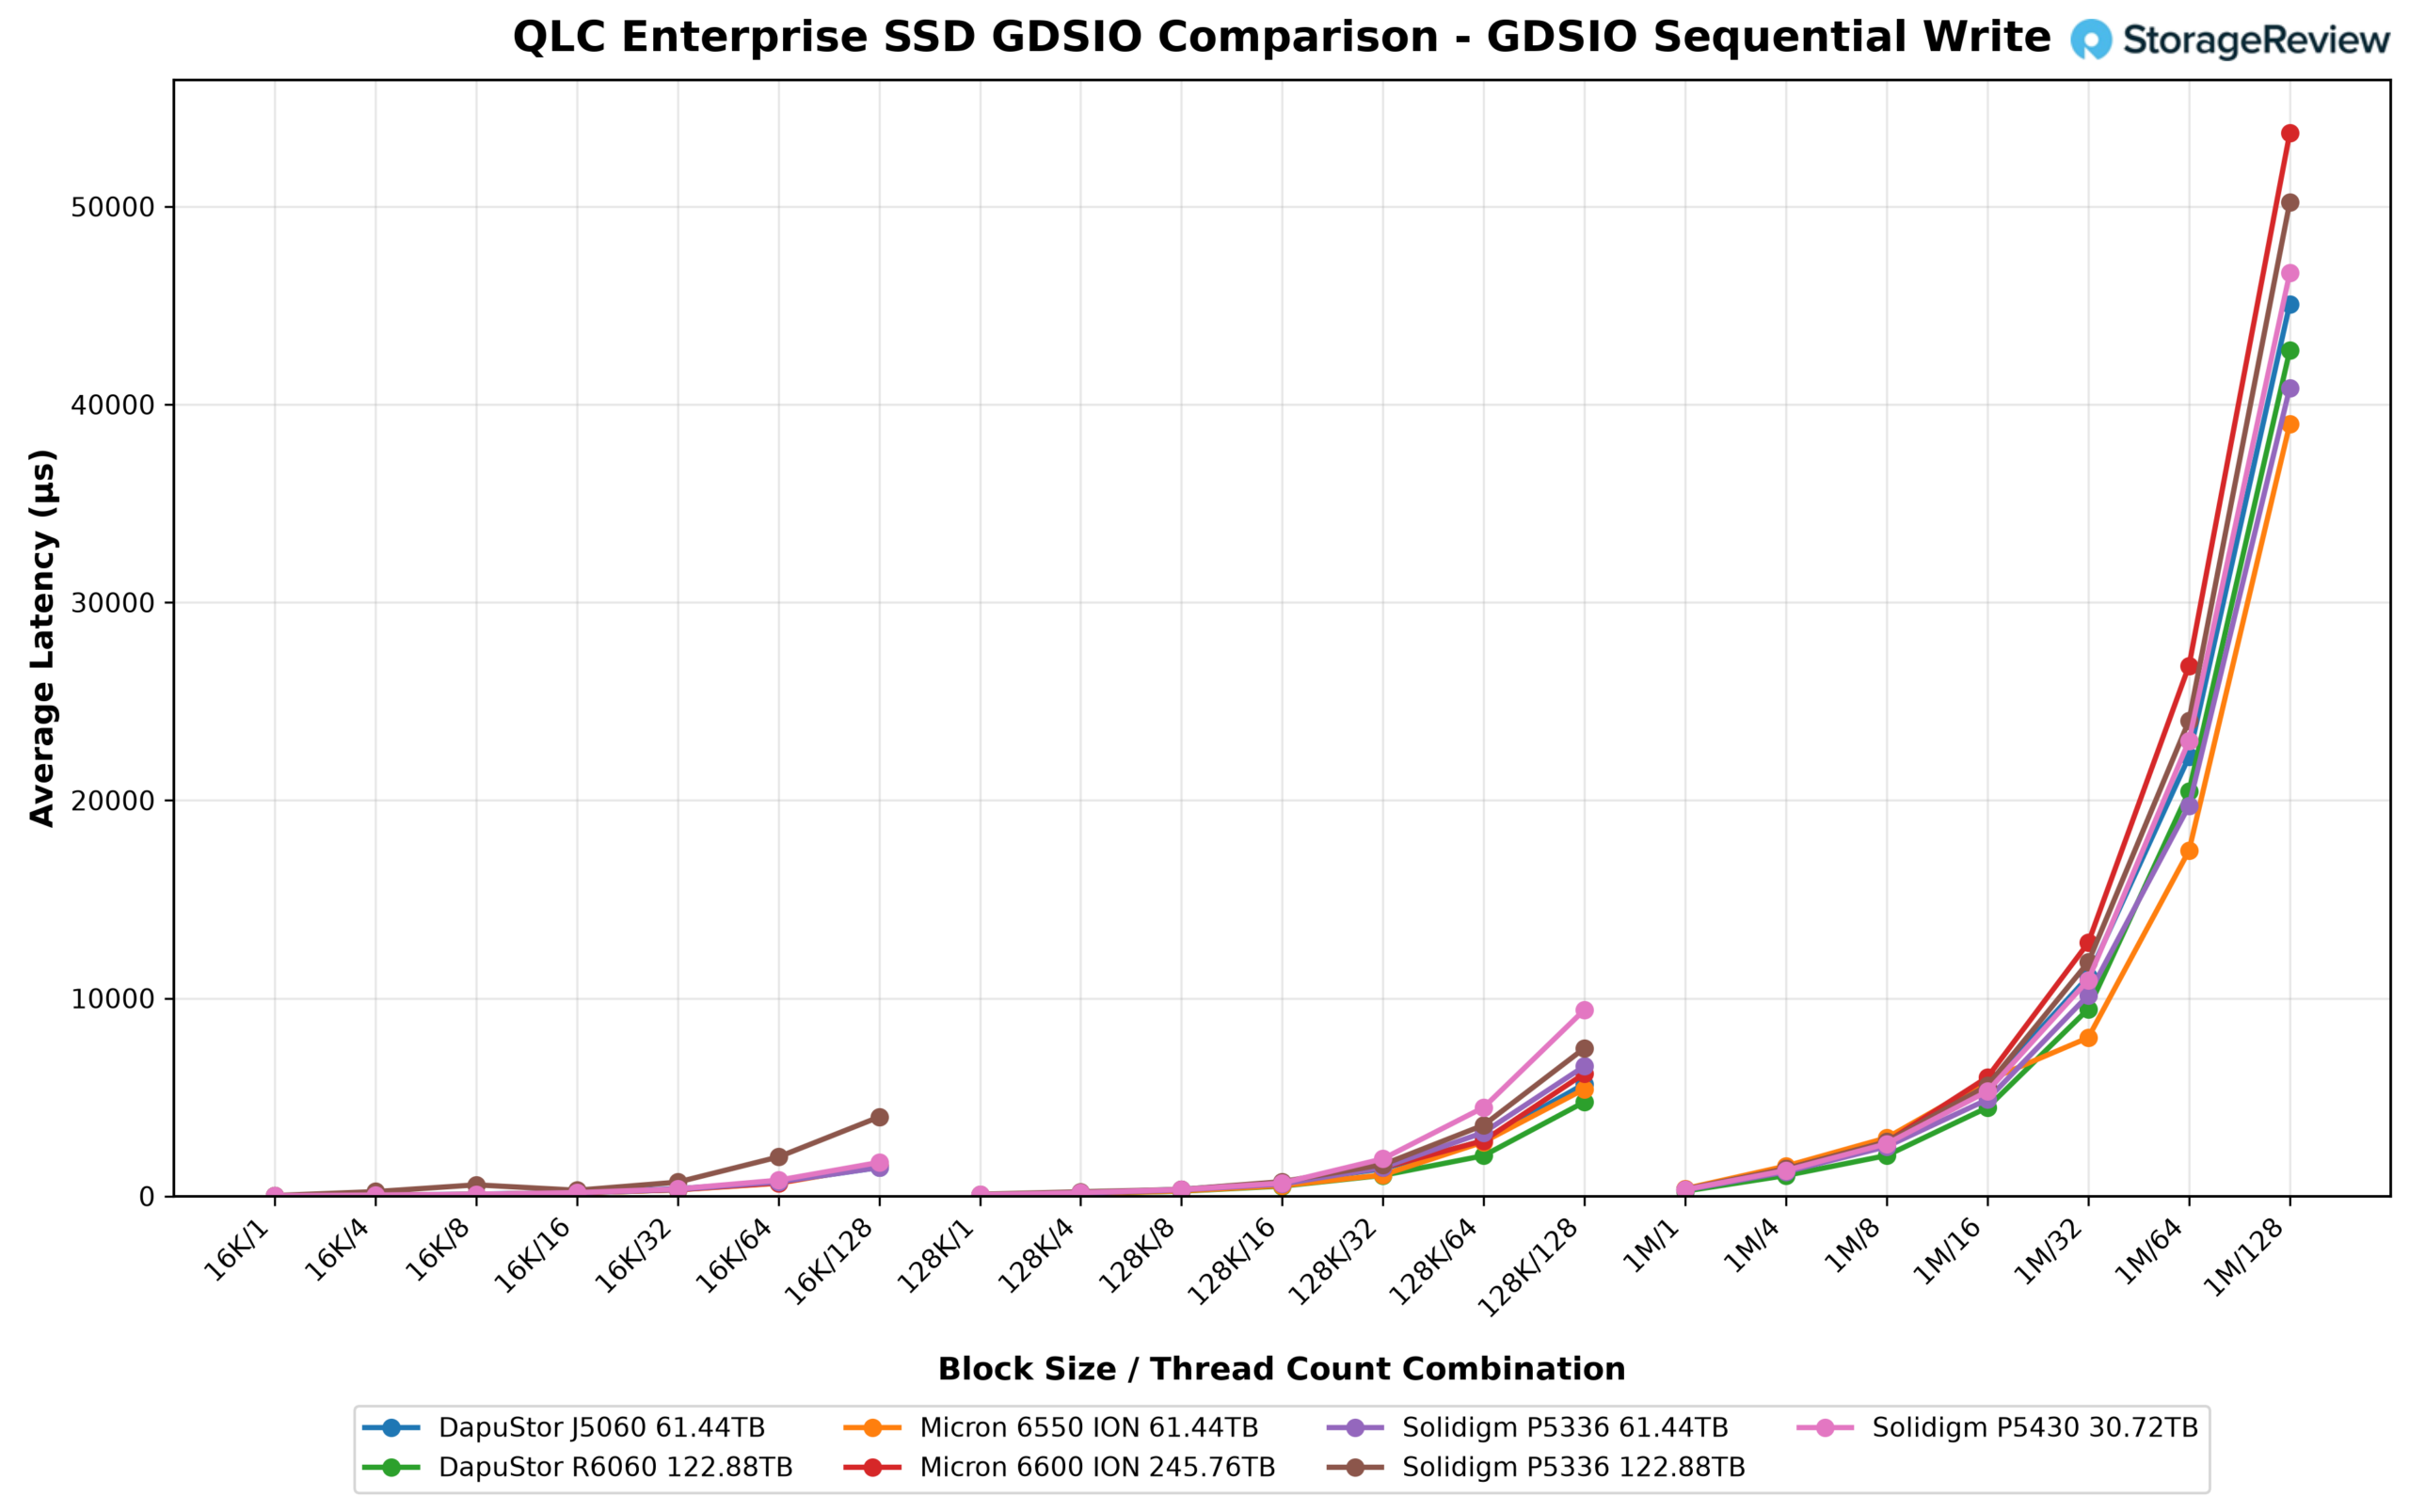
GDSIO Sequential Write Throughput
At 1M, the P5430 wrote 2.9GiB/s on a single thread, 3.0GiB/s on four threads, 2.9GiB/s from eight through 32 threads, and 2.7GiB/s on 64 and 128 threads. That’s at or above the drive’s 3,000MB/s rating (about 2.8GiB/s) from one thread through 32, with about 10 percent fade from peak at 128 threads, and it placed the P5430 fourth in the group at 1M behind the R6060 at 3.8GiB/s, the 6550 ION’s 3.9GiB/s spike at 32 threads, and the P5336 61.44TB at 3.2GiB/s, while beating the 6600 ION at 2.95GiB/s, the J5060 at 2.8GiB/s, and the P5336 122.88TB at 2.86GiB/s.
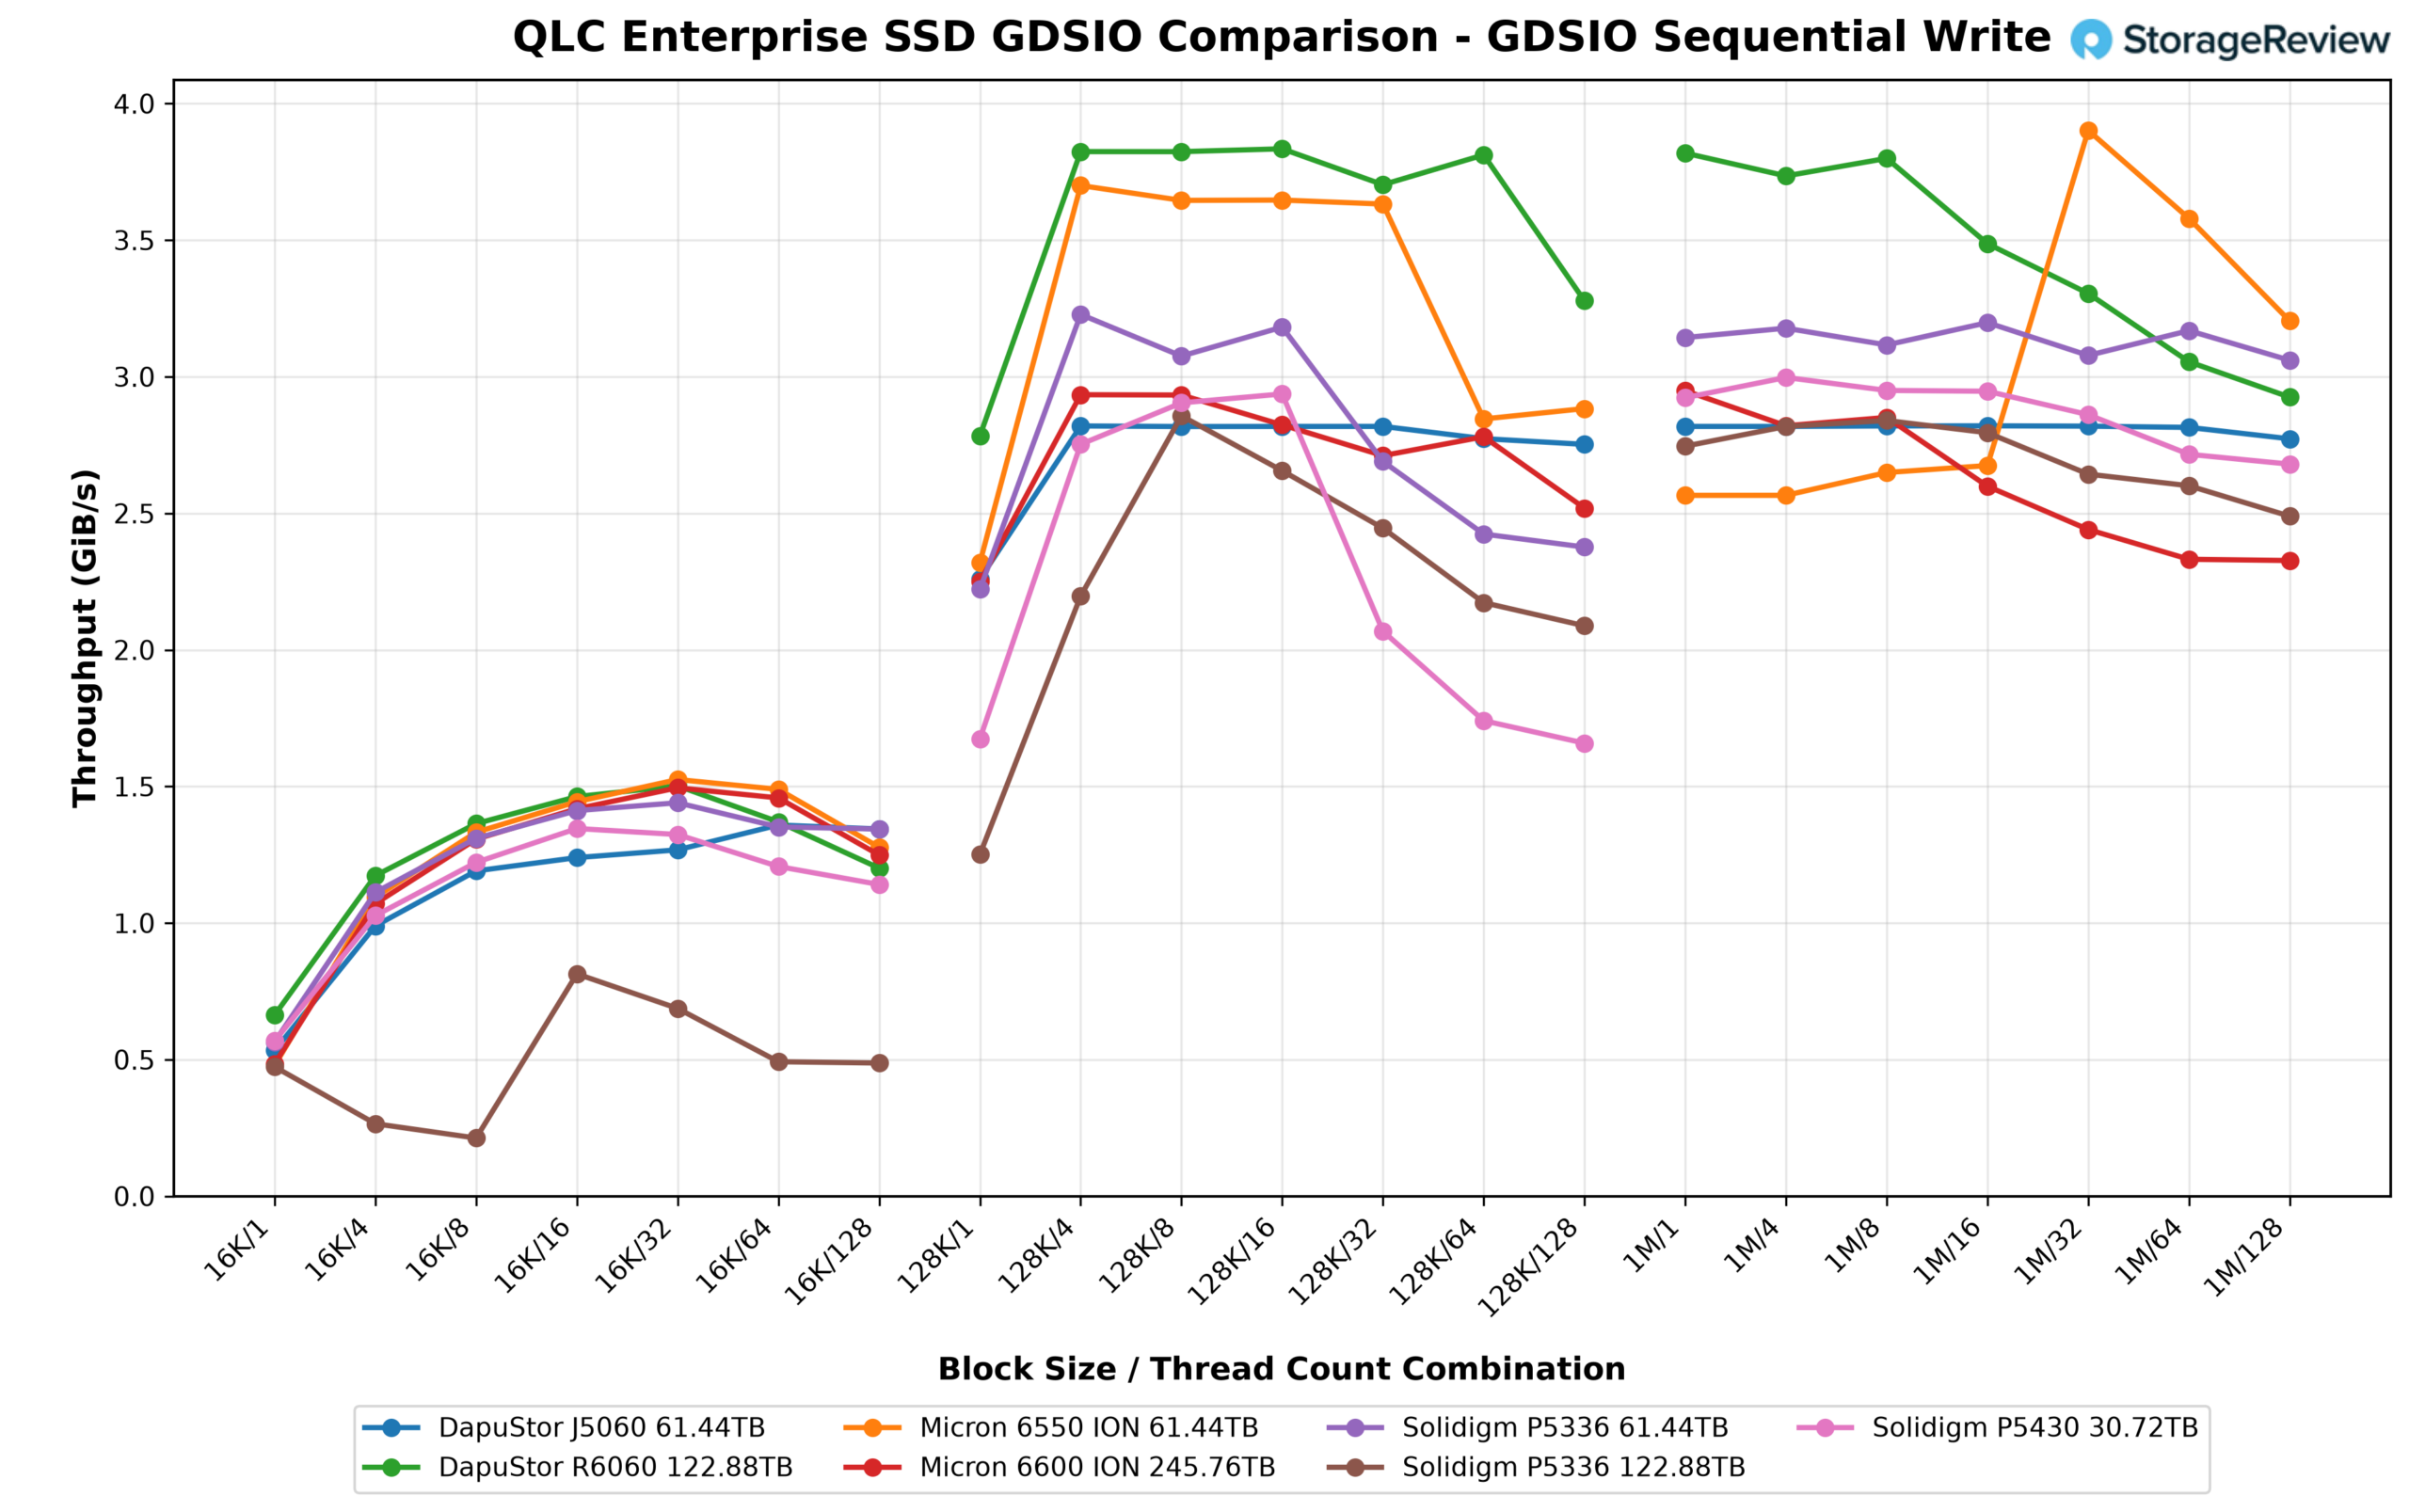
At 128K, the P5430 rose from 1.7GiB/s with one thread to 2.8GiB/s with four and 2.9GiB/s with eight and 16, then dropped to 2.1GiB/s with 32, 1.7GiB/s with 64, and 1.7GiB/s with 128. The P5336 122.88TB showed the same taper on a lower base, from 2.8GiB/s at eight threads to 2.1GiB/s at 128, and the P5336 61.44TB eased from 3.2GiB/s to 2.4GiB/s, so the fall-off under deep 128K write queues looks like a Solidigm QLC family trait shared by all three drives. The DapuStor R6060 and Micron 6550 ION held 3.7GiB/s to 3.8GiB/s through 64 threads at 128K, and the J5060 was flat at 2.8GiB/s across the sweep. At 16K, the P5430 ranged from 582MiB/s to 1.3GiB/s, in the same band as everything except the P5336 122.88TB, which never cleared 0.8GiB/s at 16K.
GDSIO Sequential Write IOPS
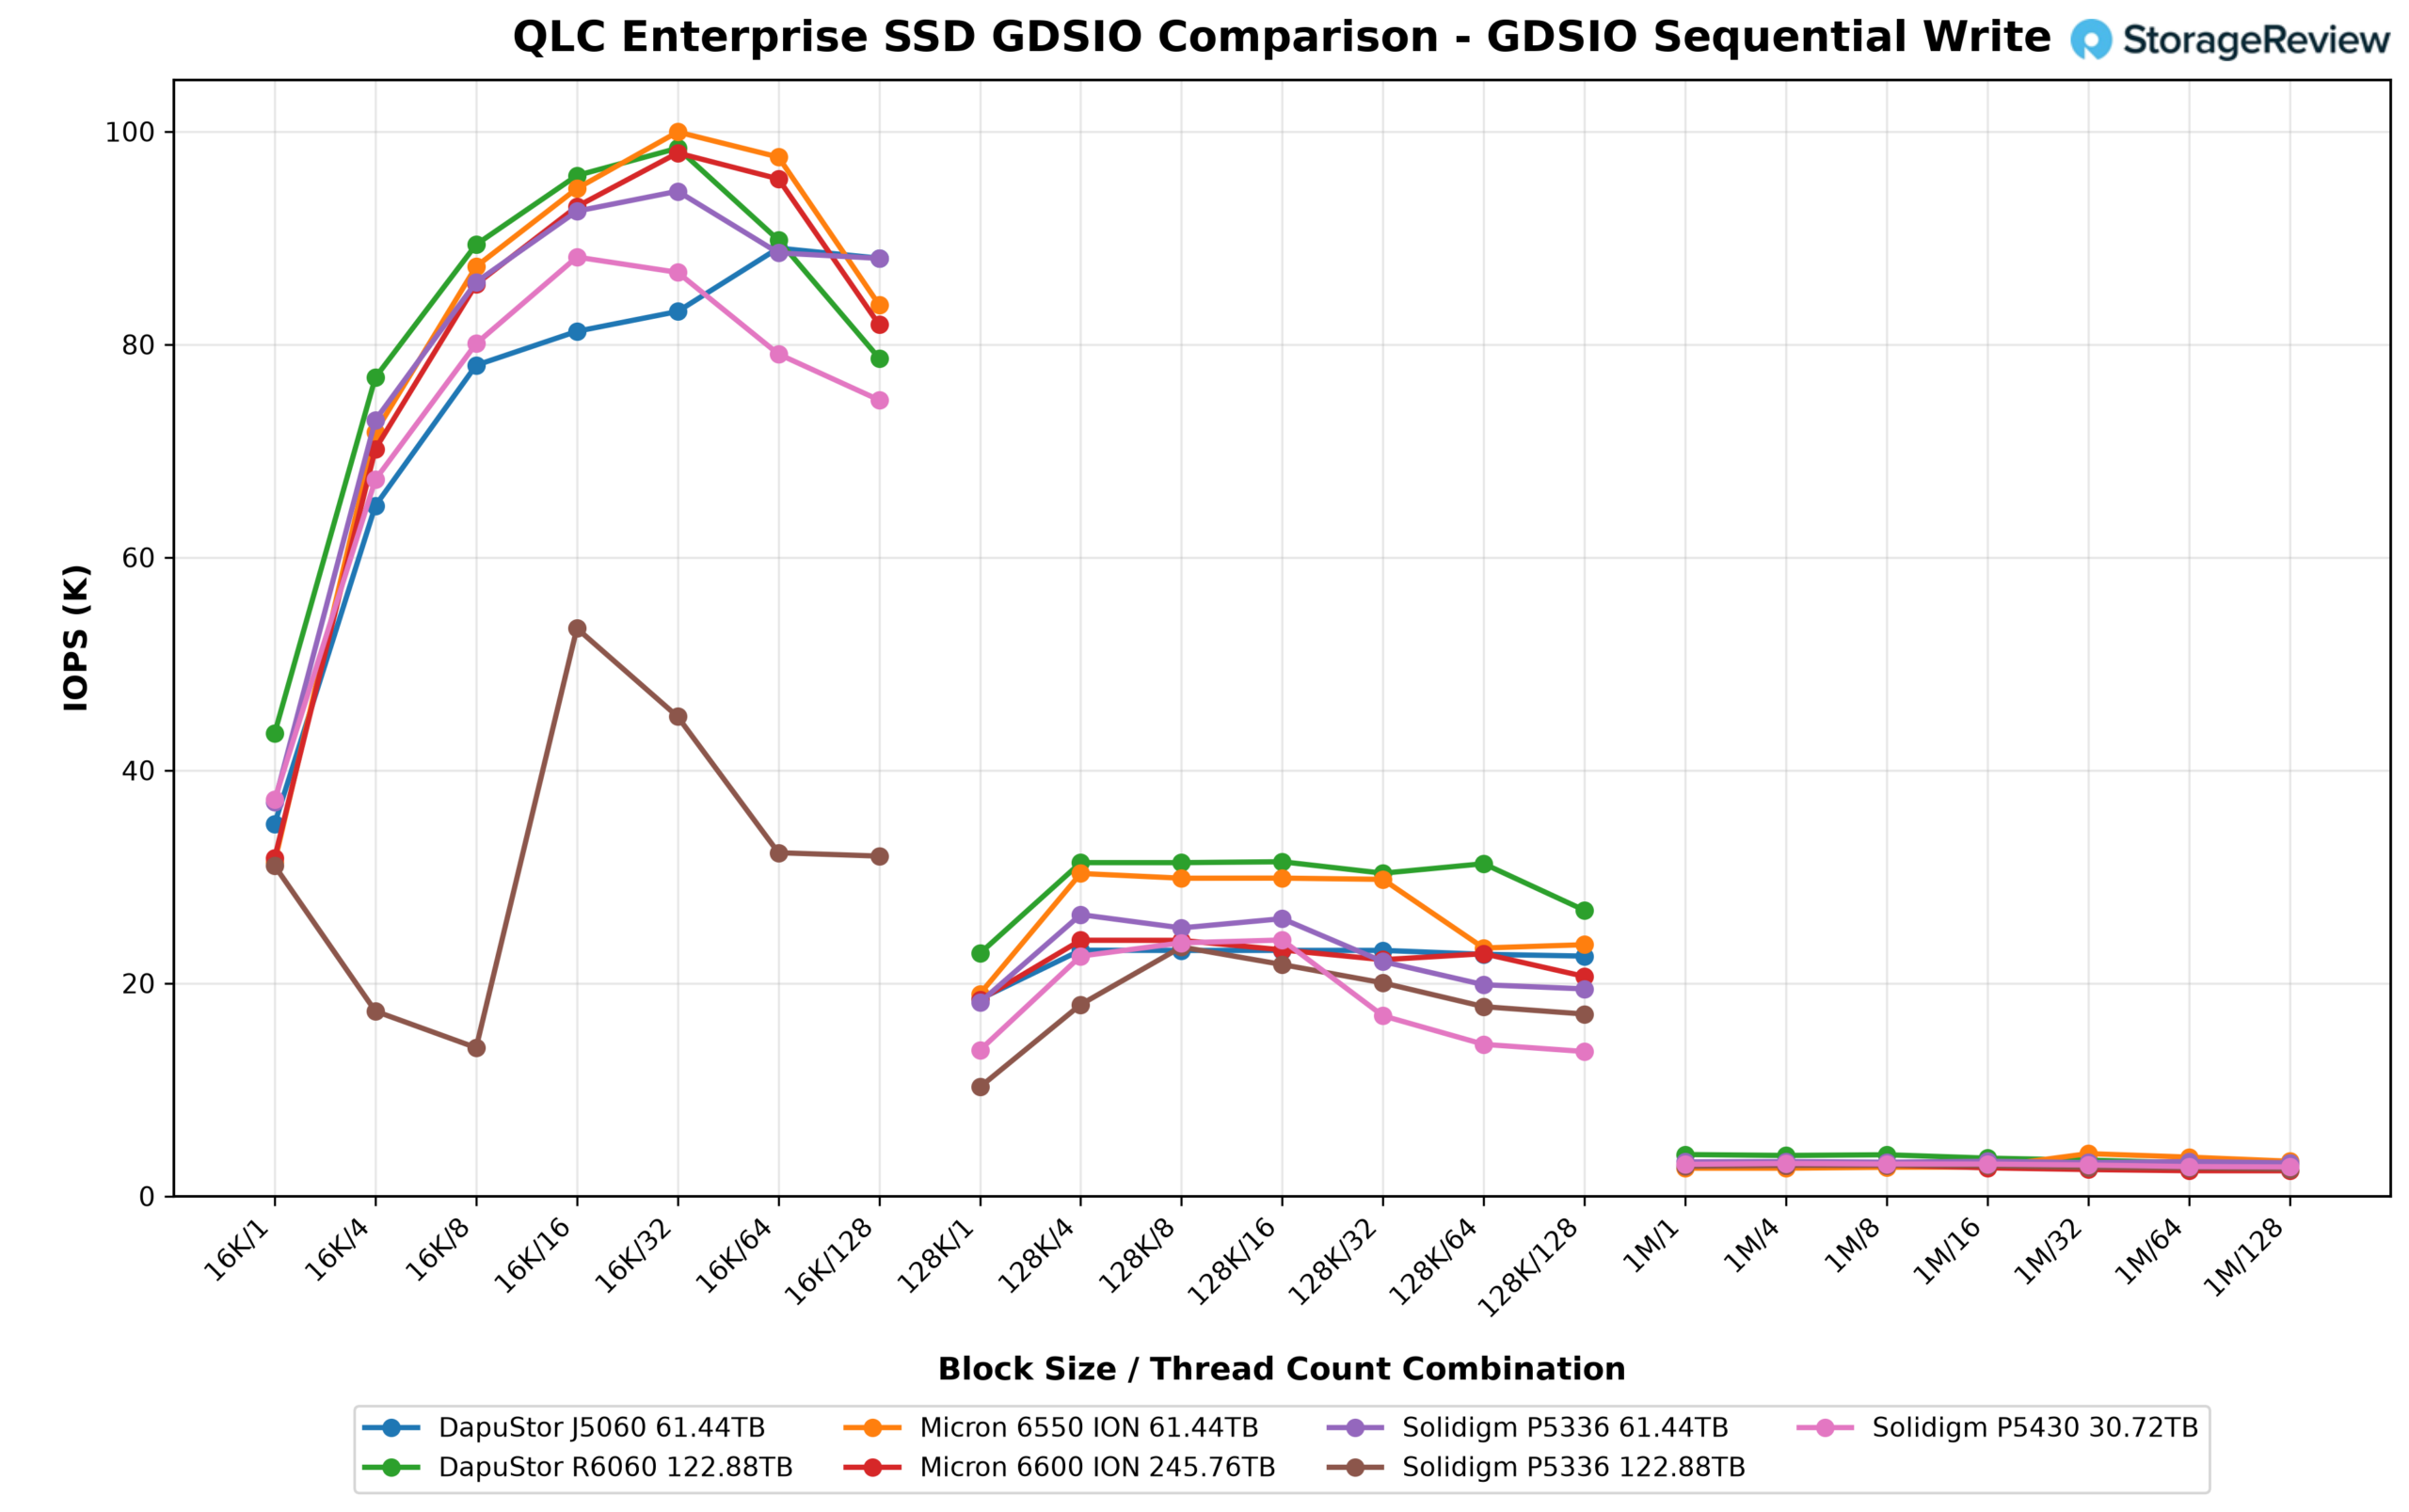
The P5430’s 16K sequential write IOPS peaked at 88.2K at 16 threads, which put it sixth in a group where five drives land between 94K and 100K: the 6550 ION at 100.0K, the R6060 at 98.4K, the 6600 ION at 98.0K, the P5336 61.44TB at 94.4K, and the J5060 at 89.0K. The P5336 122.88TB at 53.3K is the only drive well below. The spread from the 6550 ION down to the P5430 is 12 percent, across drives with two to eight times the P5430’s capacity.
GDSIO Sequential Write Latency
Single-thread 16K write latency came in at 26.0µs for the P5430, second only to the R6060 at 21.9µs and tied with the P5336 61.44TB, with the J5060 at 26.9µs, the 6600 ION at 30.6µs, the 6550 ION at 30.7µs, and the P5336 122.88TB at 31.2µs. The P5430 kept that position through the lighter and mid-range 16K and 128K loads. At the heavy end it separated in the other direction: at 128K and 128 threads its 9.4ms was the highest in the group, a consequence of the throughput taper above, and at 1M and 128 threads it finished around 47ms, between the 6600 ION at 54ms and the P5336 122.88TB at 50ms on the high side and the J5060, R6060, P5336 61.44TB, and 6550 ION at 39ms to 45ms below it.
DLIO Checkpointing Benchmark
To evaluate SSD real-world performance in AI training environments, we utilized the Data and Learning Input/Output (DLIO) benchmark tool. Developed by Argonne National Laboratory, DLIO is specifically designed to test I/O patterns in deep learning workloads. It provides insights into how storage systems handle challenges such as checkpointing, data ingestion, and model training. The test is designed so that each drive is fully populated with full checkpoints; larger SSDs fit more checkpoints. When training machine learning models, checkpoints are essential for periodically saving the model’s state, preventing loss of progress during interruptions or power failures. This storage demand requires sustained write performance, especially in long training runs. We used the DLIO benchmark version 2.0 from the August 13, 2024, release.
To ensure our benchmarking reflected real-world scenarios, we based our testing on the LLAMA 3.1 405B model architecture. We implemented checkpointing using torch.save() to capture model parameters, optimizer states, and layer states. Our setup simulated an eight-GPU system, implementing a hybrid parallelism strategy with 4-way tensor parallelism and 2-way pipeline parallelism distributed across the eight GPUs. This configuration resulted in checkpoint sizes of 1,636GB, representative of modern large language model training requirements.
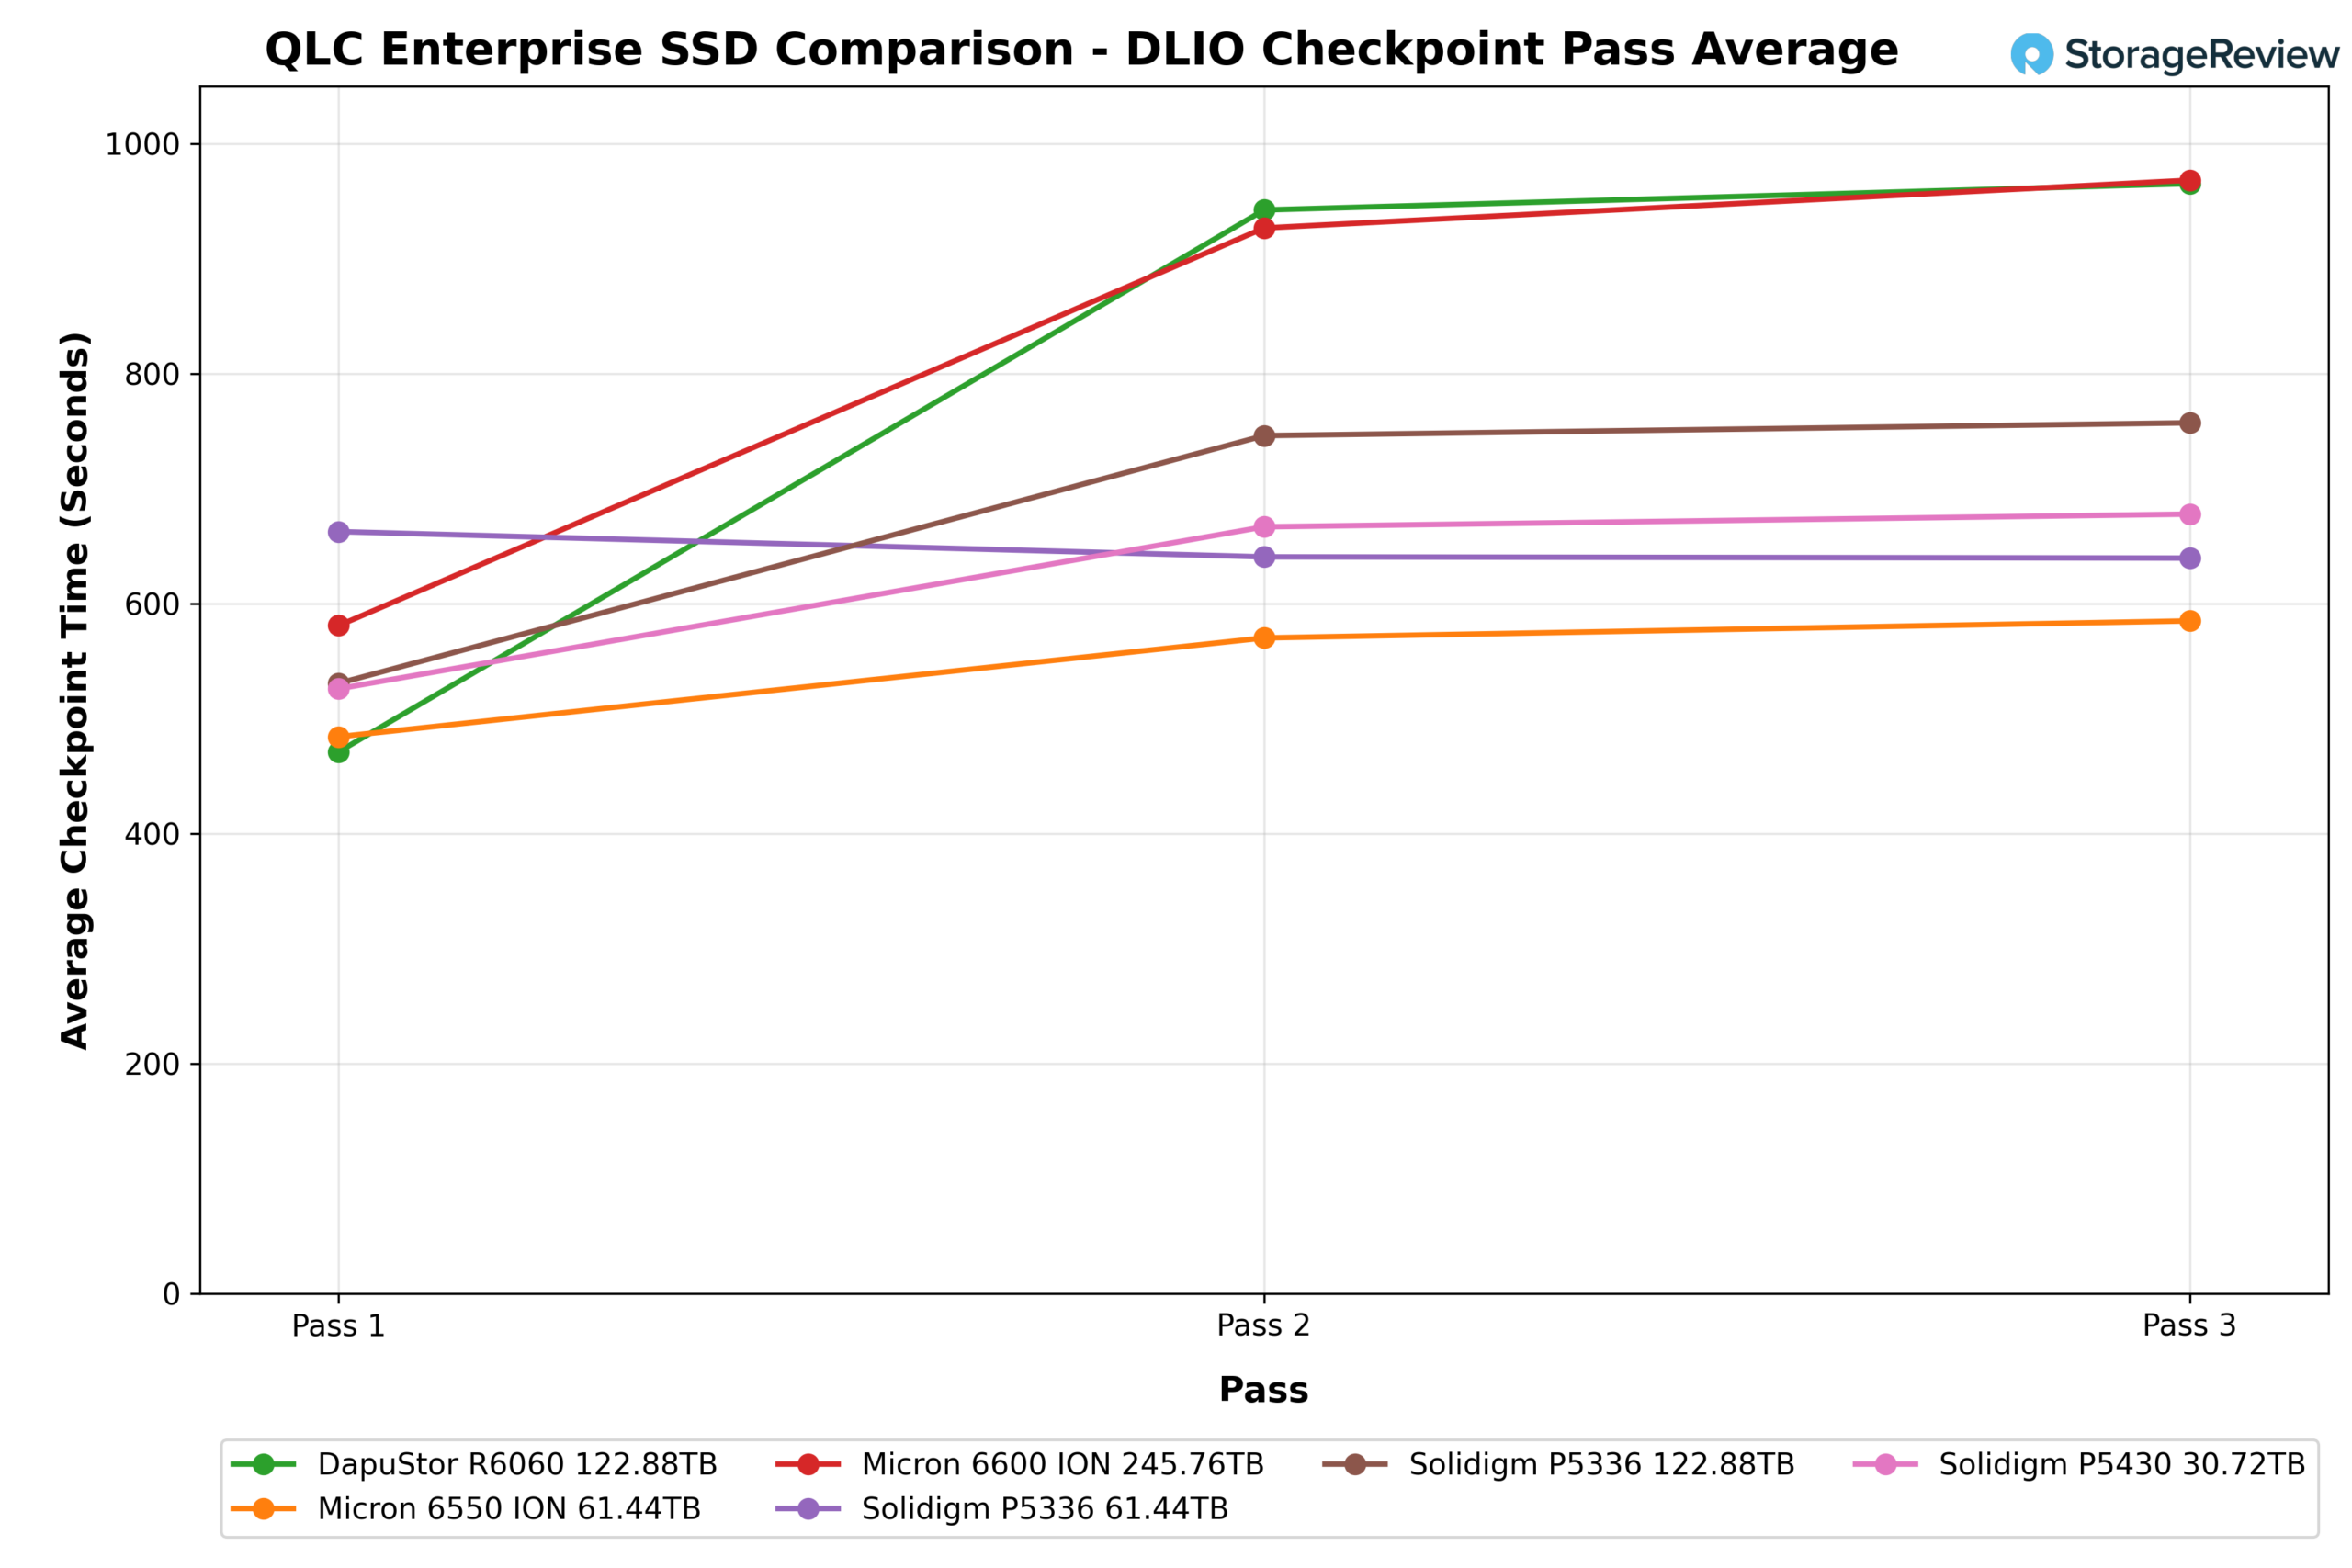
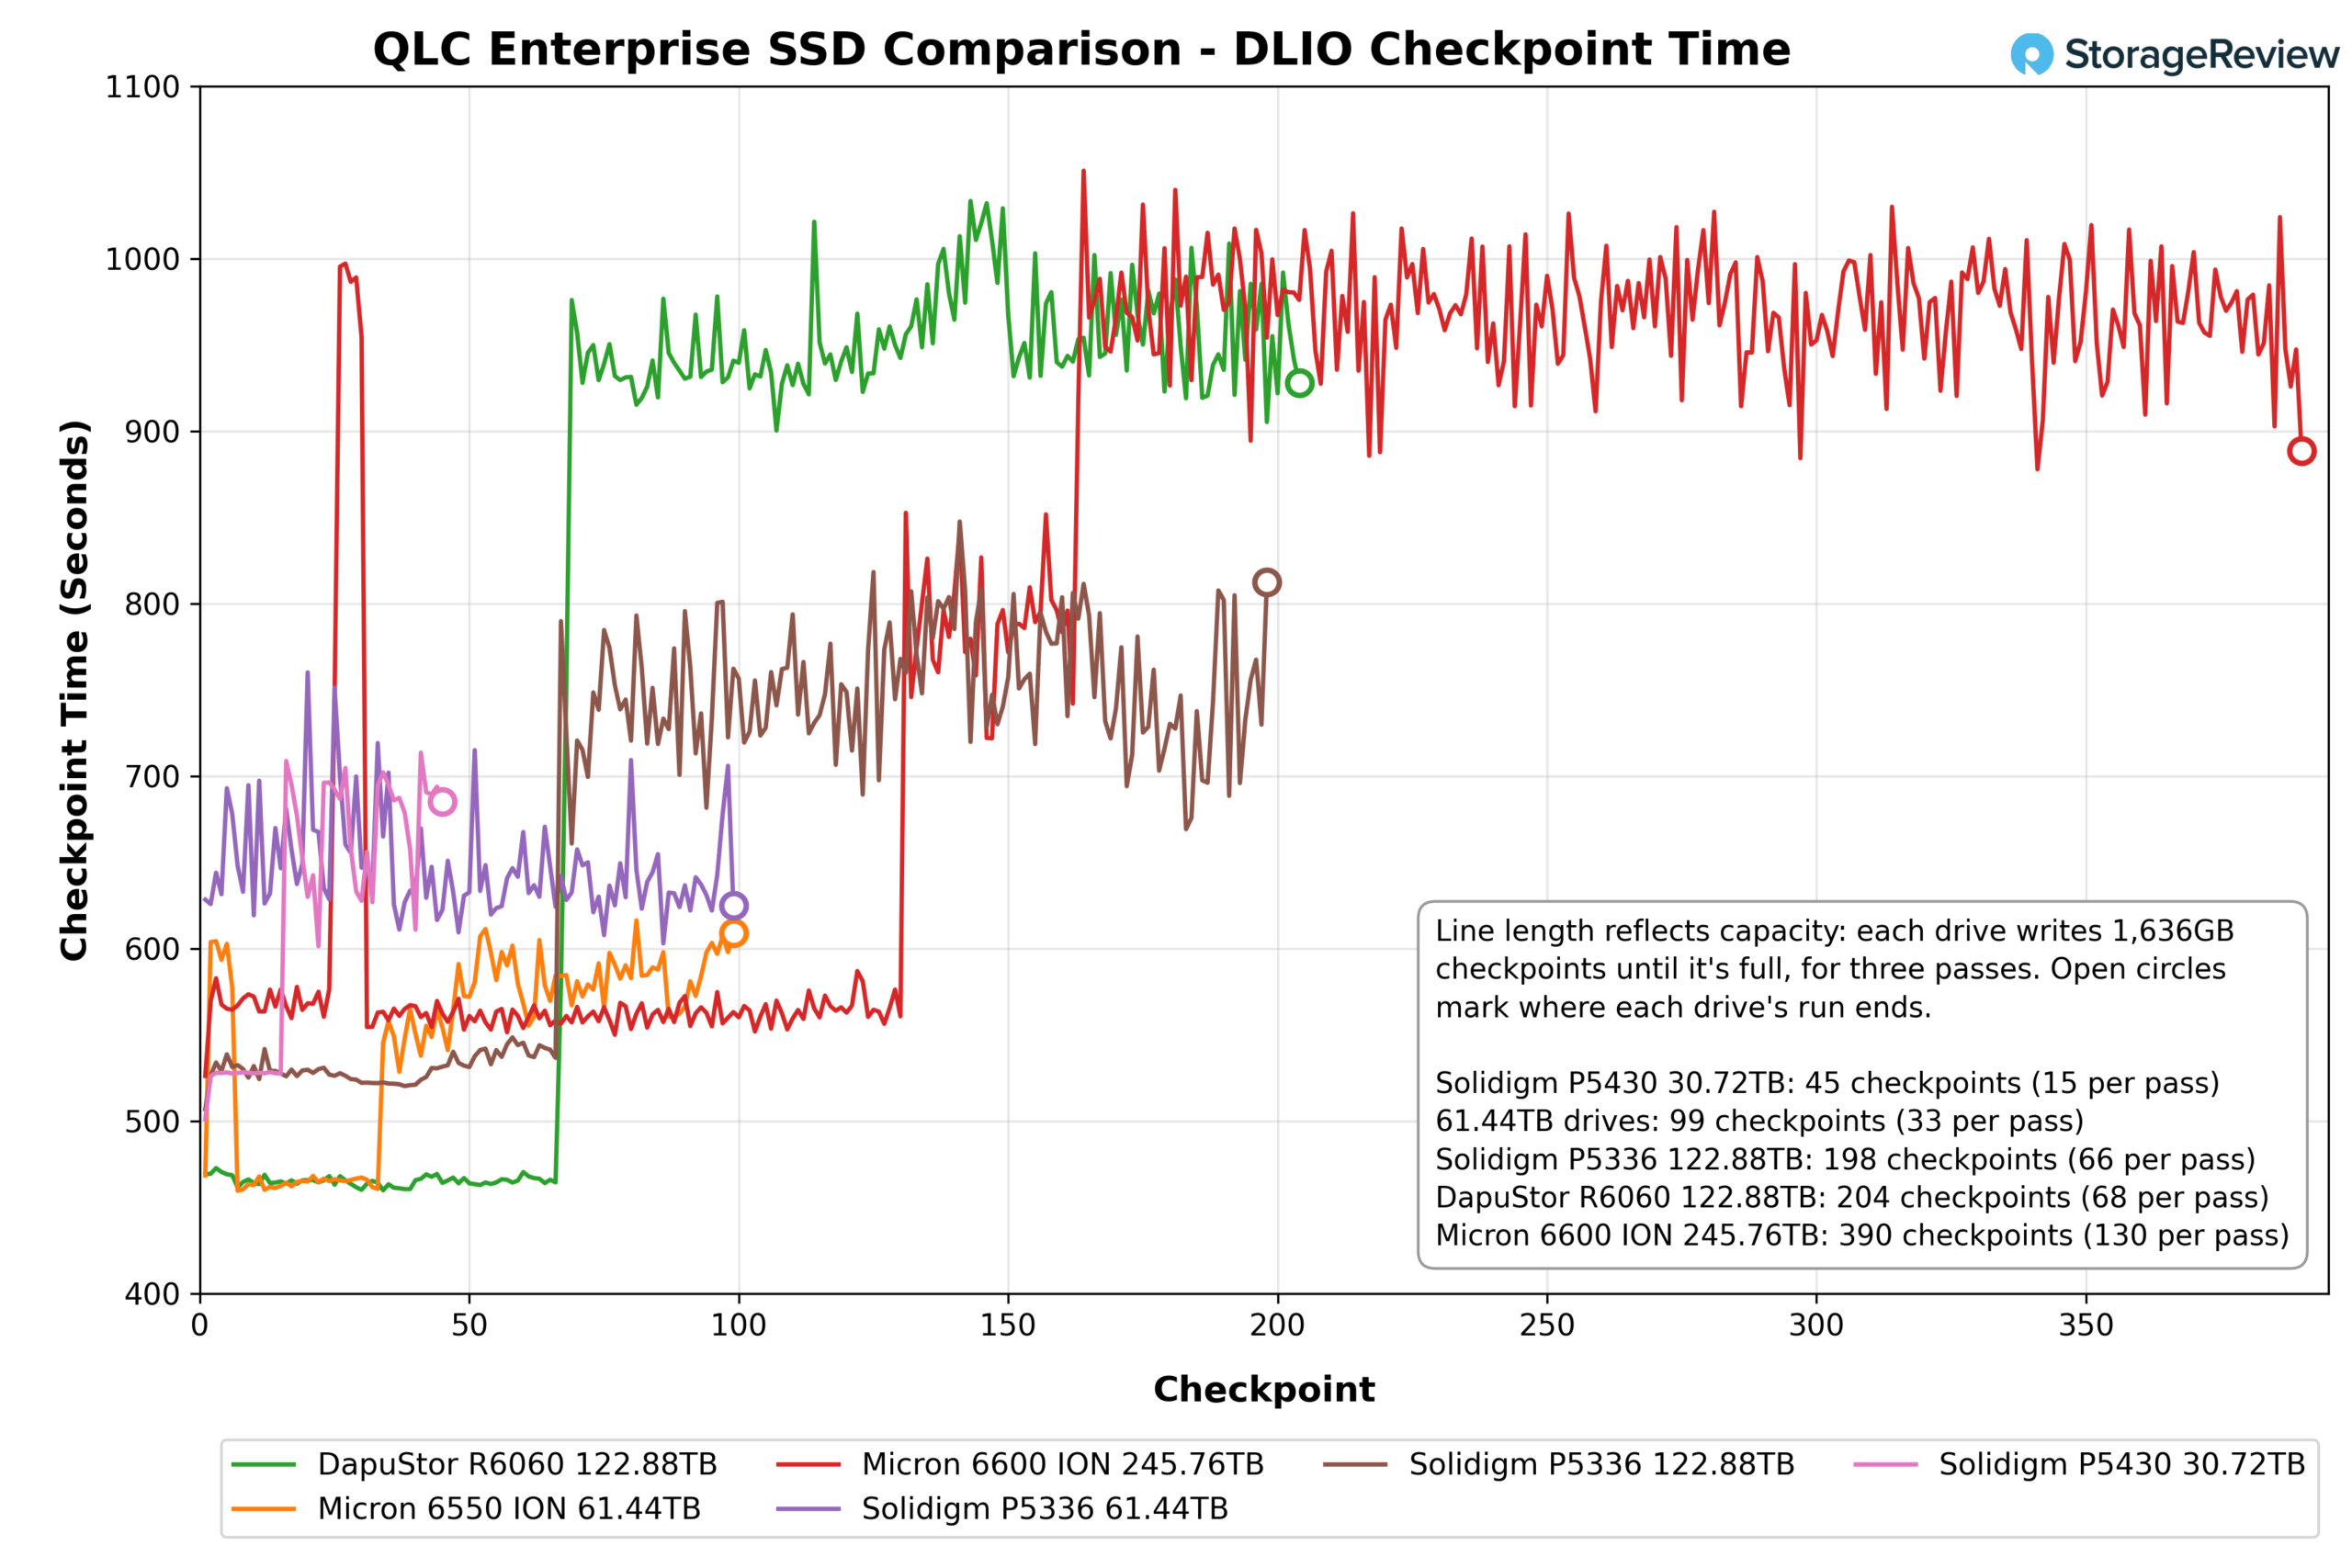
At 1,636GB each, the P5430 30.72TB holds 15 checkpoints per pass, compared with 33 for the two 61.44TB drives, 66 for the P5336 122.88TB, 68 for the R6060, and 130 for the 6600 ION. The J5060 wasn’t part of this group. The results are the average time to write one checkpoint in each of three passes.
On the first pass, the P5430 averaged 526.03 seconds per checkpoint, third behind the R6060, which posted the fastest first pass in the group, and the 6550 ION at 484.30 seconds per checkpoint. It finished just ahead of the P5336 122.88TB at 530.75 seconds, with the 6600 ION at 580.98 seconds and the P5336 61.44TB at 662.68 seconds. At 1,636GB per checkpoint, the P5430’s first pass works out to roughly 3.1GB/s, close to the 3,150MB/s write ceiling FIO measured.
The second pass started with each drive already full from the first. The P5430’s average rose 27 percent to 666.85 seconds. The R6060 roughly doubled its first-pass time for the slowest second pass in the group, the 6600 ION rose 60 percent to 926.70 seconds, and the P5336 122.88TB rose 41 percent to 746.14 seconds, while the 6550 ION climbed 18 percent to 570.23 seconds and the P5336 61.44TB got slightly faster at 640.71 seconds.
Third-pass averages moved less than 5 percent from pass two on every drive. The P5430 finished at 677.89 seconds, up 1.7 percent, and placed third again behind the 6550 ION at 585.03 seconds and the P5336 61.44TB at 639.63 seconds. That’s about 10 percent less time per checkpoint than the P5336 122.88TB at 757.31 seconds and about 30 percent less than the R6060 at 965.27 seconds and the 6600 ION at 968 seconds.
After a 501.2-second first checkpoint, the P5430 held between 526.2 and 528.4 seconds for the other 14 checkpoints of the first pass, a 2.2-second spread; the P5336 122.88TB, the next tightest, ranged from 520.3 to 548.6 seconds across its first pass. From checkpoint 16 through checkpoint 45, the P5430 ran in a wider band, between 601.4 and 713.6 seconds, with no step-up between the second and third passes. The P5336 122.88TB followed the same two-level pattern, with times of 661 to 848 seconds after its first pass, and the R6060 and 6600 ION finished their runs in the 878 to 1,034-second range.
Conclusion
The Solidigm D5-P5430 30.72TB is a three-year-old design on a Gen4 interface, and the GDSIO results indicate it has aged well for its tier. On large-block GPU-direct reads it delivered 3.8GiB/s at 1M, roughly 90 percent of what the 61TB and 122TB Gen4 QLC drives managed and about two-thirds of the Gen5 R6060 and 6600 ION, and on writes it held at or above its 3,000MB/s rating from a single thread through 32 threads with about 10 percent fade at 128, and its 3.0GiB/s peak beat the 6600 ION, the J5060, and the P5336 122.88TB. Single-thread latency of 27.8µs on reads and 26.0µs on writes put it in the top three of the group on both, and its 16K write IOPS landed within 12 percent of drives two to eight times its capacity. The two places it gave ground were the ones a Gen4 drive is expected to give: the 128K and 1M read ceilings, where the Gen5 pair ran away, and deep-queue 128K writes, where it tapered to 1.7GiB/s the same way its P5336 siblings did.
In FIO, the P5430 sat on the Gen4 ceiling everywhere the workload was read-bound, at 7,132.1MB/s in 128K sequential read, 7,125MB/s in 64K random read, and 975.2K IOPS in 4K random read, and it wrote at a flat 3,150MB/s in 128K sequential and 64K random with no fade at any queue depth. The 4K random write result is where it separates from the class: a 152.5K IOPS peak and 111.7K or better on every combination up to 64 outstanding I/Os except one, against peaks of 45.5K and 51.2K for the two 122TB QLC drives and a 6600 ION that swung between 41K and 114K. The P5430 runs an 8KB indirection unit at this capacity, against 16KB on the P5336 and the 6600 ION.
In DLIO checkpointing, the P5430 wrote its first pass at roughly 3.1GB/s, close to its FIO write ceiling, with a 2.2-second spread across the last 14 checkpoints, and settled at 677.89 seconds per 1,636GB checkpoint by the third pass. That put it third in the group, behind the TLC 6550 ION and the P5336 61.44TB, and it took about 10 percent less time per checkpoint than the P5336 122.88TB and about 30 percent less than the R6060 and 6600 ION. The 122TB and 245TB drives hold four to nine times as many checkpoints per fill, but after the first pass, each one took longer to write.
Even though we were a bit slow to review this drive, the P5430 fits in 2026 as the mainstream QLC slot Solidigm designed it for: read-heavy content and object tiers, warm data lakes feeding GPUs at large block sizes, and virtualized or mixed workloads where the P5336’s 16KB indirection unit isn’t the best fit. The case against it is the case against Gen4 QLC generally: a buyer building new on Gen5 gets 62 to 96 percent more 128K sequential read bandwidth and two to eight times the capacity per slot from the newer drives, if those are the buying decision drivers. For everyone else, the P5430 remains a sensible 30TB drive, with the endurance, power, and small-block performance that the bigger QLC drives don’t excel at.



 Amazon